

Engineered components manufacturer for critical industries ITT Inc. (NYSE: ITT) reported Q2 CY2026 results topping the market’s revenue expectations, with sales up 51.5% year on year to $1.47 billion. Its non-GAAP profit of $2.08 per share was 6.9% above analysts’ consensus estimates.
Is now the time to buy ITT? Find out by accessing our full research report, it’s free.
ITT (ITT) Q2 CY2026 Highlights:
- Revenue: $1.47 billion vs analyst estimates of $1.39 billion (51.5% year-on-year growth, 5.9% beat)
- Adjusted EPS: $2.08 vs analyst estimates of $1.95 (6.9% beat)
- Management raised its full-year Adjusted EPS guidance to $8.22 at the midpoint, a 4.7% increase
- Operating Margin: 12.2%, down from 18% in the same quarter last year
- Free Cash Flow Margin: 11%, down from 14.1% in the same quarter last year
- Organic Revenue rose 12.7% year on year
- Market Capitalization: $18.24 billion
Company Overview
Playing a crucial role in the development of the first transatlantic television transmission in 1956, ITT (NYSE:ITT) provides motion and fluid handling equipment for various industries.
Revenue Growth
Examining a company’s long-term performance can provide clues about its quality. Any business can put up a good quarter or two, but many enduring ones grow for years. Thankfully, ITT’s 12% annualized revenue growth over the last five years was impressive. Its growth surpassed the average industrials company and shows its offerings resonate with customers, a great starting point for our analysis.
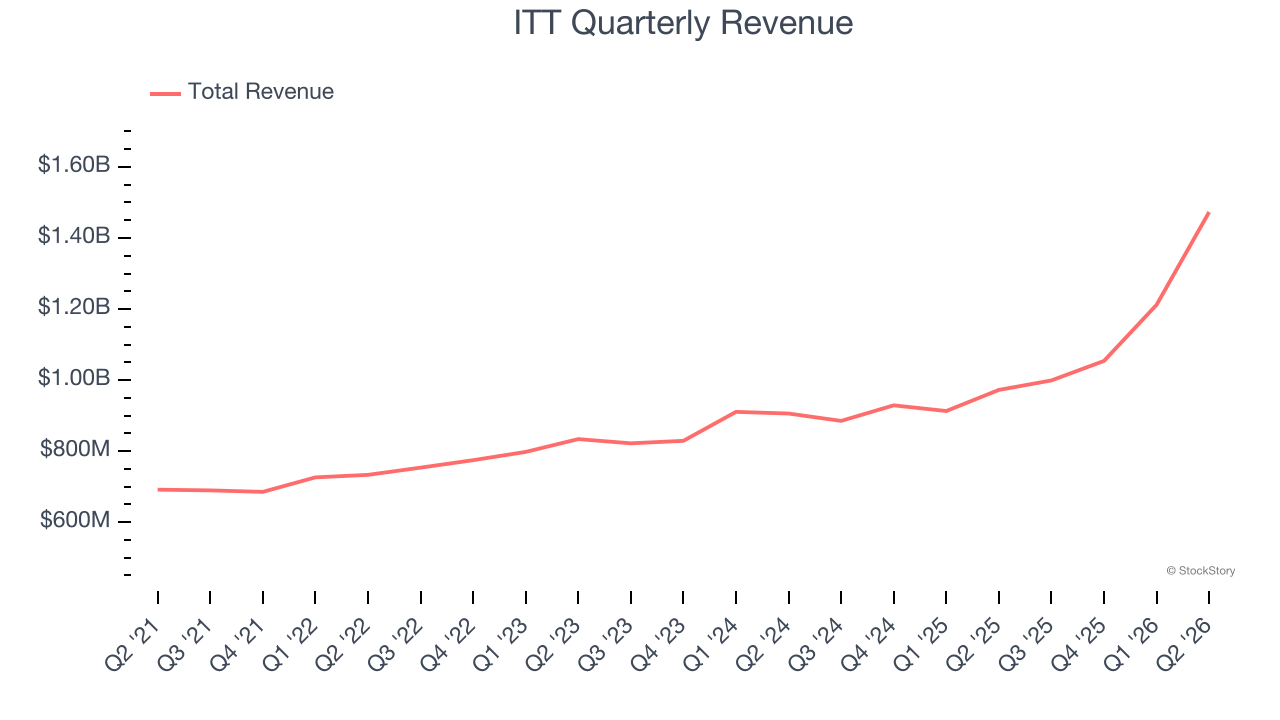
We at StockStory place the most emphasis on long-term growth, but within industrials, a half-decade historical view may miss cycles, industry trends, or a company capitalizing on catalysts such as a new contract win or a successful product line. ITT’s annualized revenue growth of 16.9% over the last two years is above its five-year trend, suggesting its demand was strong and recently accelerated. 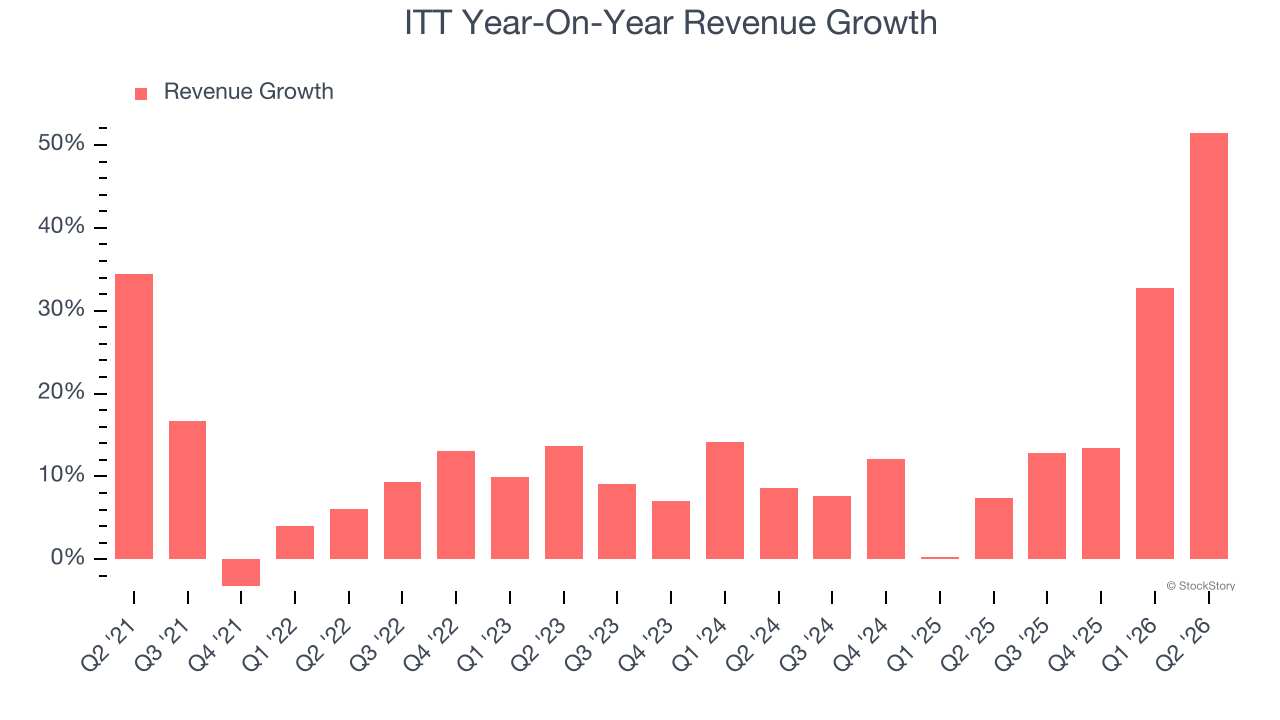
We can dig further into the company’s sales dynamics by analyzing its organic revenue, which strips out one-time events like acquisitions and currency fluctuations that don’t accurately reflect its fundamentals. Over the last two years, ITT’s organic revenue averaged 6.7% year-on-year growth. Because this number is lower than its two-year revenue growth, we can see that some mixture of acquisitions and foreign exchange rates boosted its headline results. 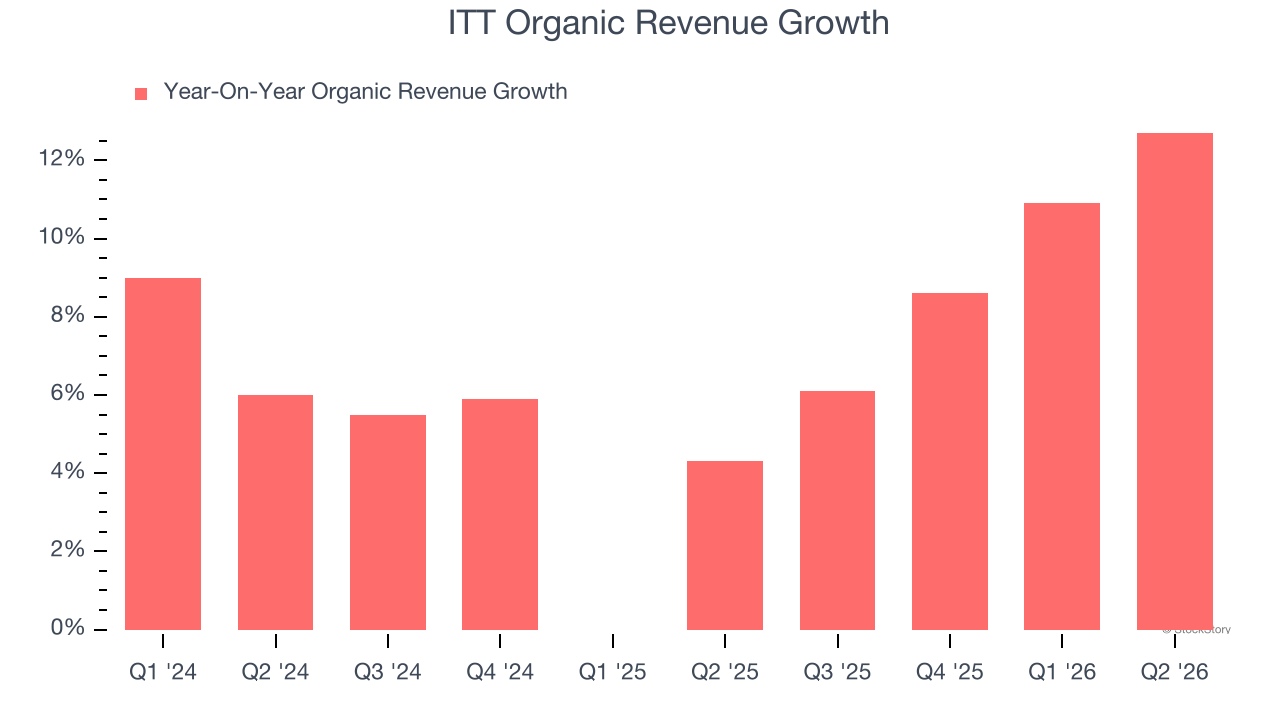
This quarter, ITT reported magnificent year-on-year revenue growth of 51.5%, and its $1.47 billion of revenue beat Wall Street’s estimates by 5.9%.
Looking ahead, sell-side analysts expect revenue to grow 20.4% over the next 12 months, an improvement versus the last two years. This projection is eye-popping and indicates its newer products and services will catalyze better top-line performance.
ONE MORE THING: 3 Hidden Platforms Growing 3X Faster than Amazon, Google, and PayPal. Amazon, Google, and Meta all followed the same playbook: Dominate an ignored market. Build an unbeatable moat. Scale until you’re unstoppable.
These three platforms are running that exact playbook right now. The early investors in Amazon made fortunes. The early investors in these could do the same. Get All 3 Stocks Here for FREE.
Operating Margin
ITT’s operating margin has generally stayed the same over the last 12 months, averaging 16.2% over the last five years. This profitability was elite for an industrials business thanks to its efficient cost structure and economies of scale. This is seen in its fast historical revenue growth and healthy gross margin, which is why we look at all three data points together.
Analyzing the trend in its profitability, ITT’s operating margin might have fluctuated slightly but has generally stayed the same over the last five years. This raises questions about the company’s expense base because its revenue growth should have given it leverage on its fixed costs, resulting in better economies of scale and profitability.
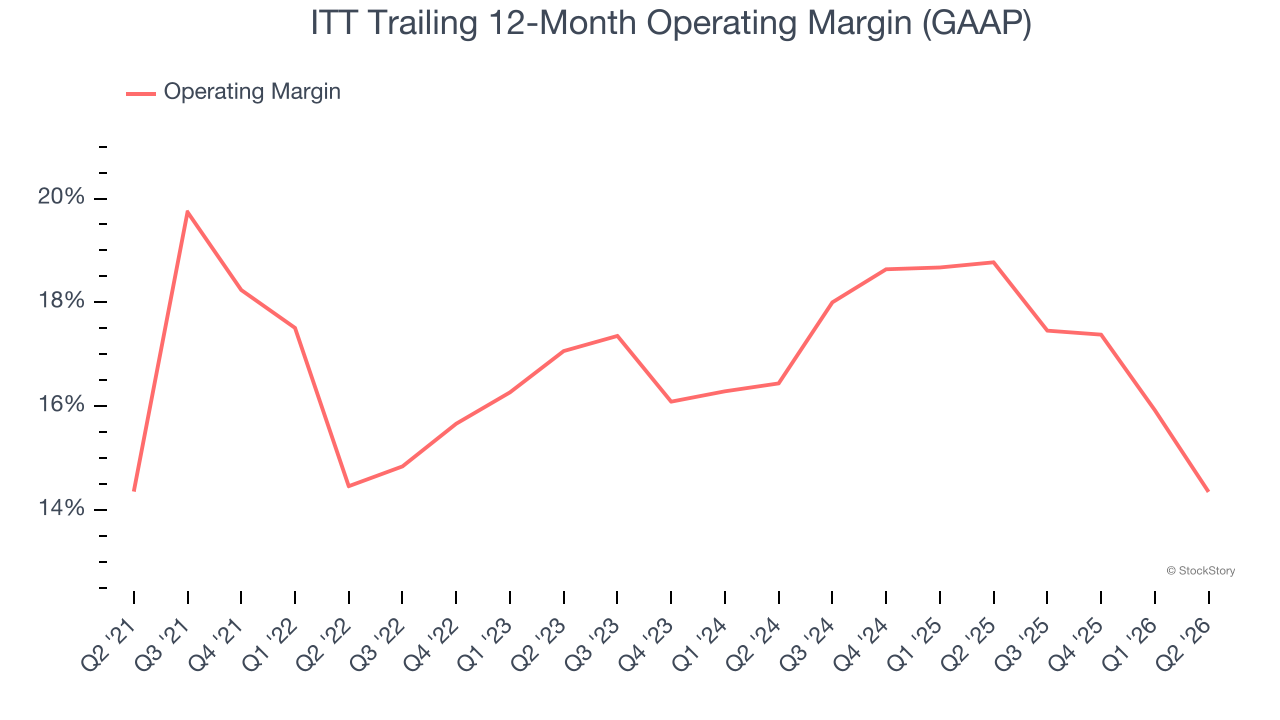
This quarter, ITT generated an operating margin profit margin of 12.2%, down 5.8 percentage points year on year. Since ITT’s operating margin decreased more than its gross margin, we can assume it was less efficient because expenses such as marketing, R&D, and administrative overhead increased.
Earnings Per Share
We track the long-term change in earnings per share (EPS) for the same reason as long-term revenue growth. Compared to revenue, however, EPS highlights whether a company’s growth is profitable.
ITT’s EPS grew at 15% compounded annual growth rate over the last five years, higher than its 12% annualized revenue growth. However, we take this with a grain of salt because its operating margin didn’t improve and it didn’t repurchase its shares, meaning the delta came from reduced interest expenses or taxes.
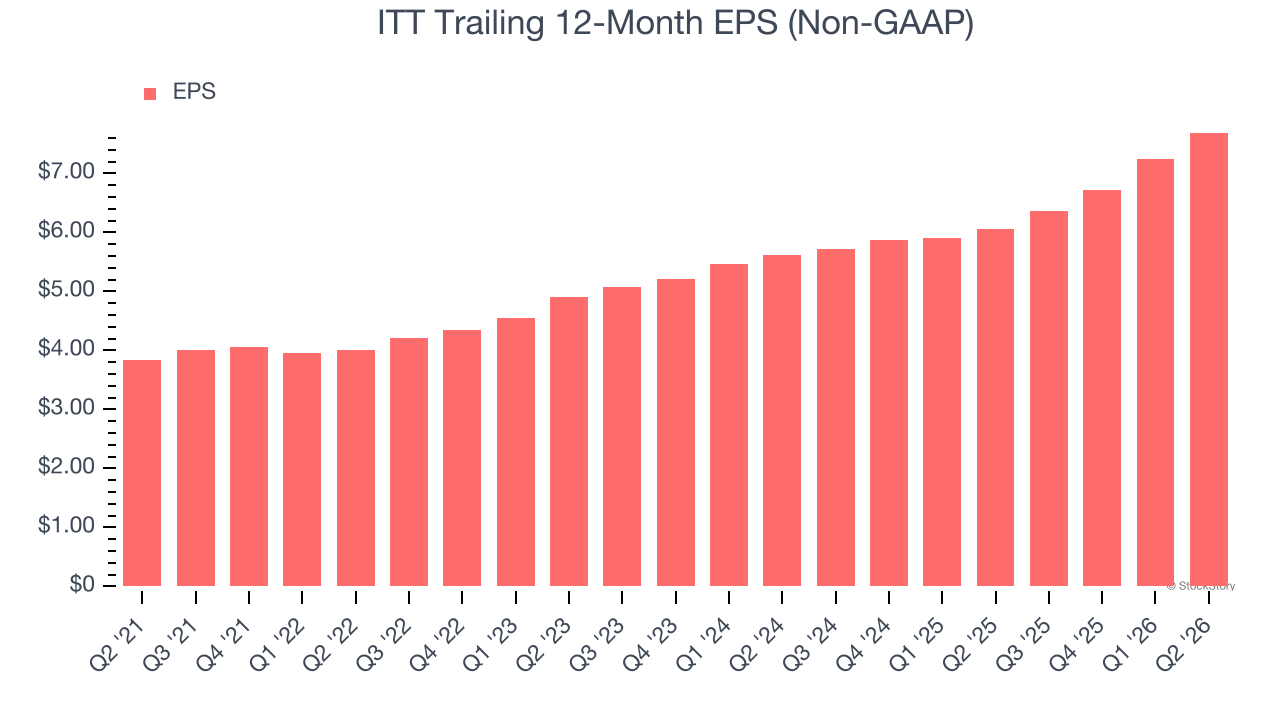
Like with revenue, we analyze EPS over a shorter period to see if we are missing a change in the business.
For ITT, its two-year annual EPS growth of 17% was higher than its five-year trend. We love it when earnings growth accelerates, especially when it accelerates off an already high base.
In Q2, ITT reported adjusted EPS of $2.08, up from $1.64 in the same quarter last year. This print beat analysts’ estimates by 6.9%. Over the next 12 months, Wall Street expects ITT’s full-year EPS to grow 9.6% from $7.69 to $8.43.
Key Takeaways from ITT’s Q2 Results
We were impressed by how significantly ITT blew past analysts’ revenue expectations this quarter. We were also glad its full-year EPS guidance trumped Wall Street’s estimates. Zooming out, we think this was a good print with some key areas of upside. The stock traded up 4.2% to $212.87 immediately after reporting.
Indeed, ITT had a rock-solid quarterly earnings result, but is this stock a good investment here? The latest quarter does matter, but not nearly as much as longer-term fundamentals and valuation, when deciding if the stock is a buy. We cover that in our actionable full research report which you can read here (it’s free).