

Economic consulting firm CRA International (NASDAQ:CRAI) reported Q2 CY2026 results exceeding the market’s revenue expectations, with sales up 12.8% year on year to $210.8 million. Its non-GAAP profit of $2.16 per share was 0.6% above analysts’ consensus estimates.
Is now the time to buy CRA? Find out by accessing our full research report, it’s free.
CRA (CRAI) Q2 CY2026 Highlights:
- Revenue: $210.8 million vs analyst estimates of $198.9 million (12.8% year-on-year growth, 6% beat)
- Adjusted EPS: $2.16 vs analyst estimates of $2.15 (0.6% beat)
- Adjusted EBITDA: $26.82 million vs analyst estimates of $25.27 million (12.7% margin, 6.1% beat)
- Operating Margin: 11.2%, in line with the same quarter last year
- Free Cash Flow was -$6.07 million, down from $4.66 million in the same quarter last year
- Market Capitalization: $1.14 billion
Company Overview
Often retained for high-stakes matters with multibillion-dollar implications, CRA International (NASDAQ:CRAI) provides economic, financial, and management consulting services to corporations, law firms, and government agencies for litigation, regulatory proceedings, and business strategy.
Revenue Growth
A company’s long-term sales performance is one signal of its overall quality. Even a bad business can shine for one or two quarters, but a top-tier one grows for years.
With $794.6 million in revenue over the past 12 months, CRA is a small player in the business services space, which sometimes brings disadvantages compared to larger competitors benefiting from economies of scale and numerous distribution channels. On the bright side, it can grow faster because it has more room to expand.
As you can see below, CRA’s 7.5% annualized revenue growth over the last five years was solid. This is an encouraging starting point for our analysis because it shows CRA’s demand was higher than many business services companies.
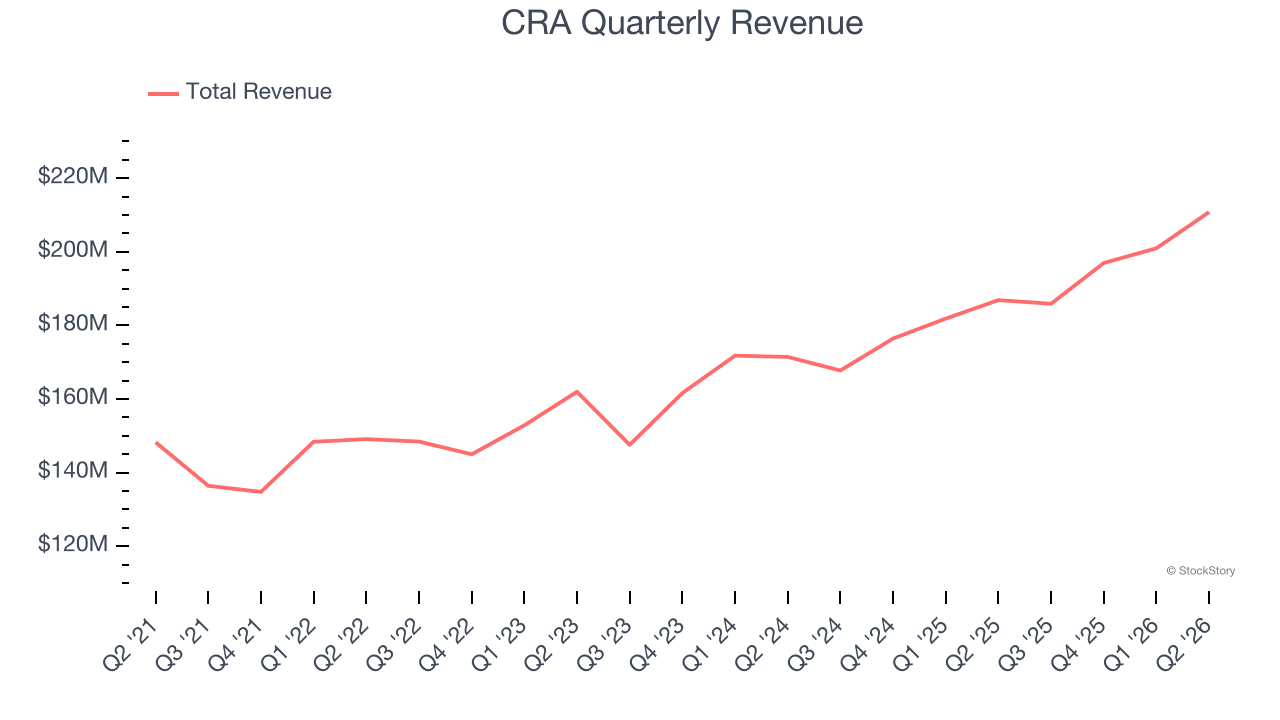
Long-term growth is the most important, but within business services, a half-decade historical view may miss new innovations or demand cycles. CRA’s annualized revenue growth of 10.4% over the last two years is above its five-year trend, suggesting its demand was strong and recently accelerated. 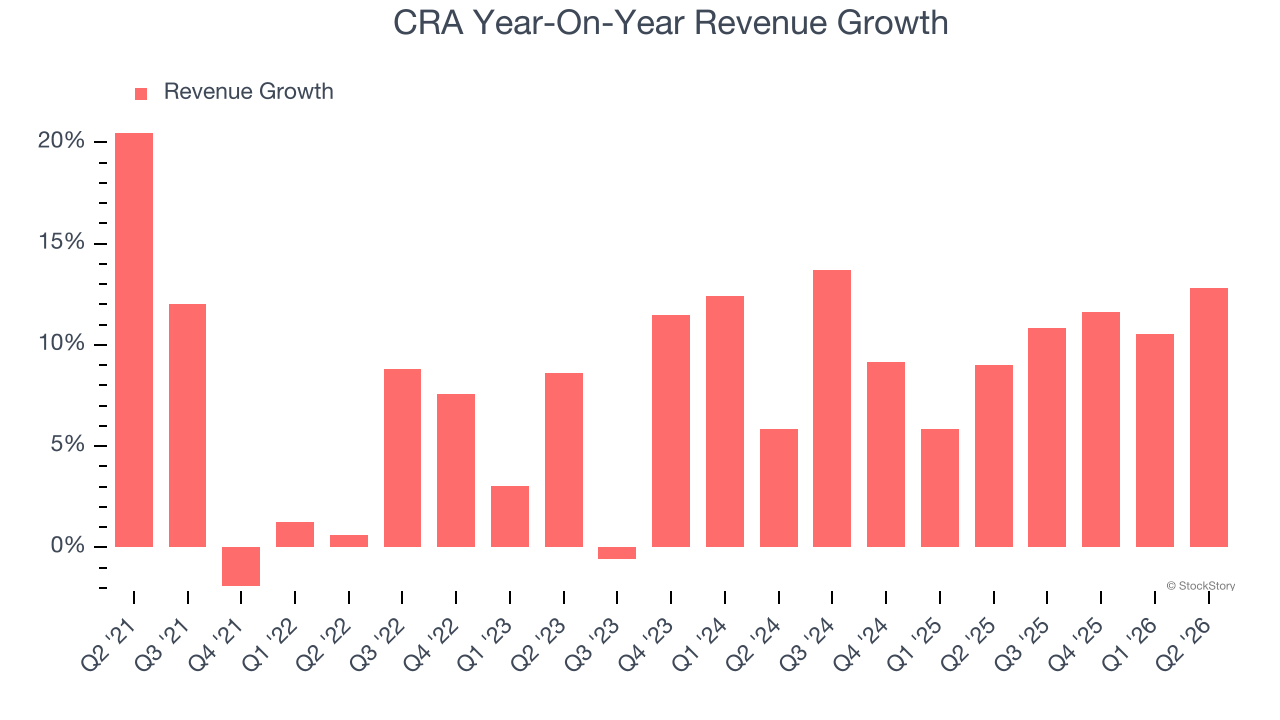
This quarter, CRA reported year-on-year revenue growth of 12.8%, and its $210.8 million of revenue exceeded Wall Street’s estimates by 6%.
Looking ahead, sell-side analysts expect revenue to grow 1.6% over the next 12 months, a deceleration versus the last two years. This projection doesn’t excite us and suggests its products and services will face some demand challenges. At least the company is tracking well in other measures of financial health.
ALSO WORTH WATCHING: Nvidia’s Quiet Partner. Nvidia’s chips cost a hundred grand. The connectors that make them work cost even more. One company makes them all.
Every AI server needs specialized infrastructure the chip companies don’t make. High-speed cables. Power connectors. Thermal sensors. This 90-year-old company built a monopoly on it. The AI boom just started. This stock is still flying under the radar. Claim The Stock Ticker Here for FREE.
Adjusted Operating Margin
CRA’s adjusted operating margin has more or less stayed the same over the last 12 months , averaging 10.6% over the last five years. This profitability was higher than the broader business services sector, showing it did a decent job managing its expenses.
Analyzing the trend in its profitability, CRA’s adjusted operating margin might have fluctuated slightly but has generally stayed the same over the last five years. This raises questions about the company’s expense base because its revenue growth should have given it leverage on its fixed costs, resulting in better economies of scale and profitability.
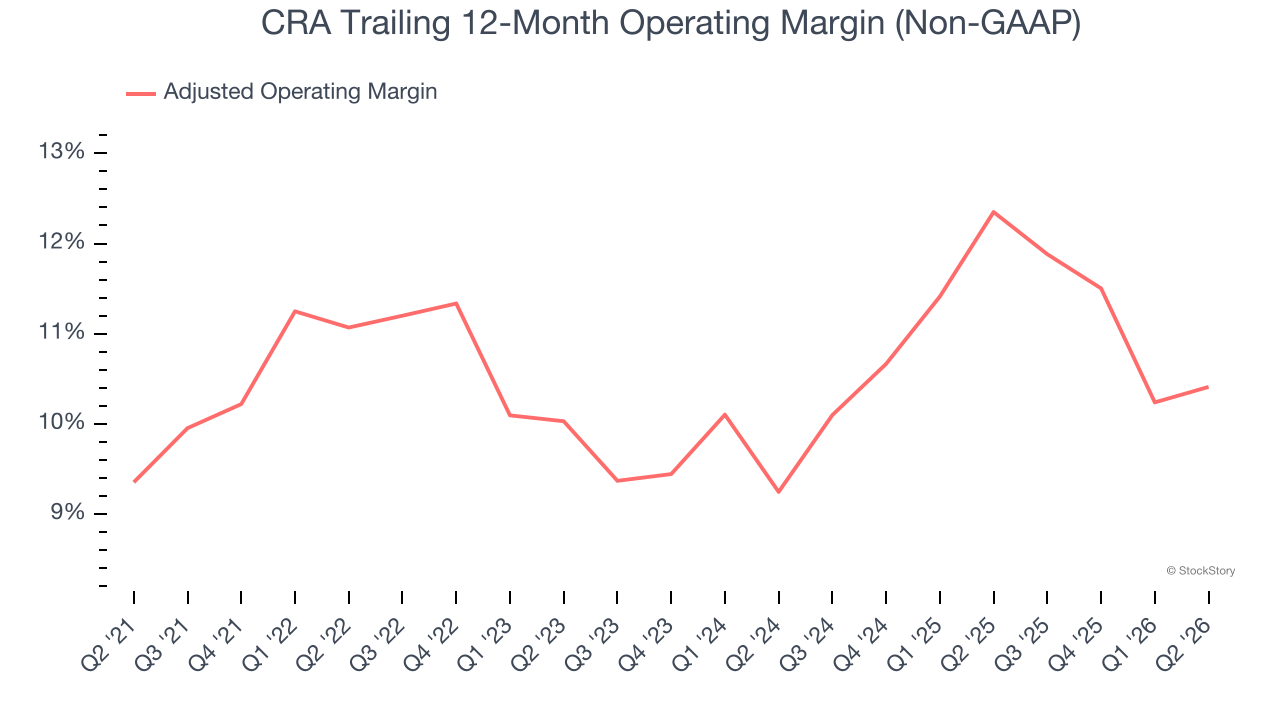
In Q2, CRA generated an adjusted operating margin profit margin of 11.2%, in line with the same quarter last year. This indicates the company’s overall cost structure has been relatively stable.
Earnings Per Share
Revenue trends explain a company’s historical growth, but the long-term change in earnings per share (EPS) points to the profitability of that growth — for example, a company could inflate its sales through excessive spending on advertising and promotions.
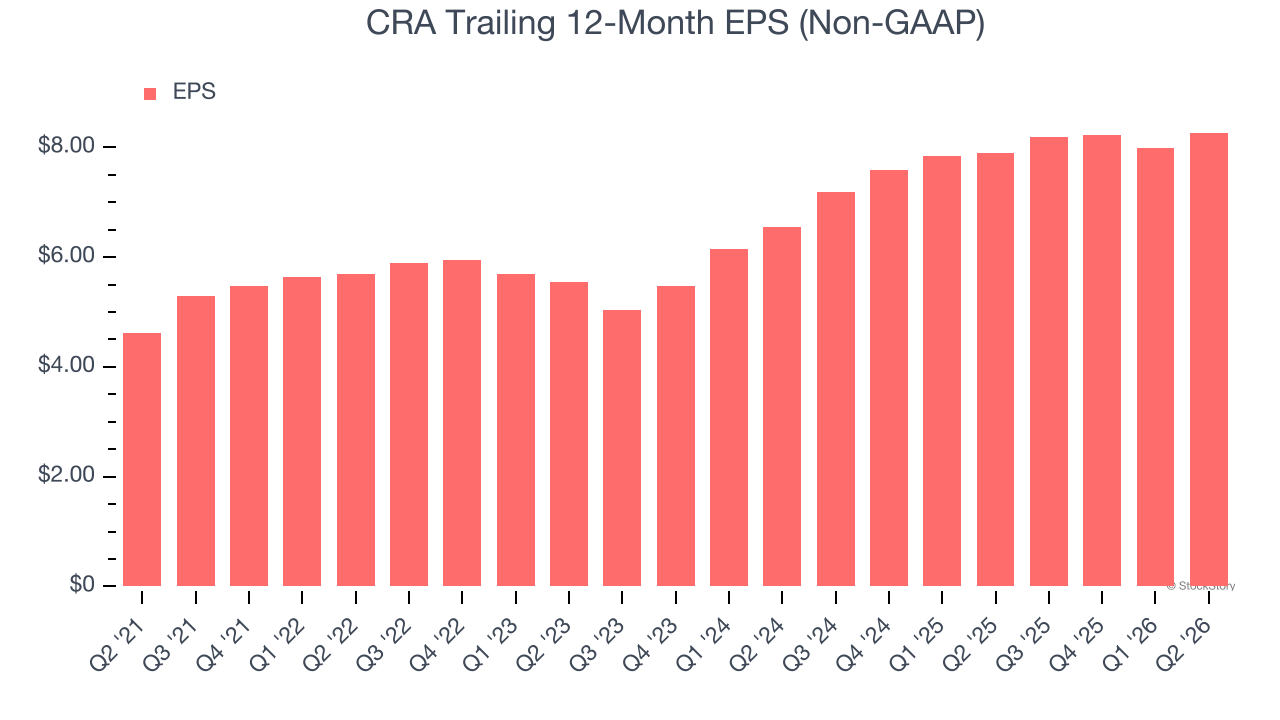
CRA’s EPS grew at 12.4% compounded annual growth rate over the last five years, higher than its 7.5% annualized revenue growth. However, this alone doesn’t tell us much about its business quality because its adjusted operating margin didn’t improve.
Like with revenue, we analyze EPS over a shorter period to see if we are missing a change in the business.
For CRA, its two-year annual EPS growth of 12.4% is similar to its five-year trend, implying strong and stable earnings power.
In Q2, CRA reported adjusted EPS of $2.16, up from $1.88 in the same quarter last year. This print was close to analysts’ estimates. Over the next 12 months, Wall Street expects CRA’s full-year EPS to grow 12.6% from $8.27 to $9.31.
Key Takeaways from CRA’s Q2 Results
We were impressed by how significantly CRA blew past analysts’ revenue expectations this quarter. Overall, we think this was a solid quarter with some key areas of upside. The stock traded up 1.9% to $179.96 immediately following the results.
CRA may have had a good quarter, but does that mean you should invest right now? When making that decision, it’s important to consider its valuation, business qualities, as well as what has happened in the latest quarter. We cover that in our actionable full research report which you can read here (it’s free).