

Pharmaceutical company Amphastar Pharmaceuticals (NASDAQAMPH) reported Q2 CY2026 results topping the market’s revenue expectations, with sales up 5.4% year on year to $183.9 million. Its non-GAAP profit of $0.91 per share was 48.3% above analysts’ consensus estimates.
Is now the time to buy Amphastar Pharmaceuticals? Find out by accessing our full research report, it’s free.
Amphastar Pharmaceuticals (AMPH) Q2 CY2026 Highlights:
- Revenue: $183.9 million vs analyst estimates of $180.3 million (5.4% year-on-year growth, 2% beat)
- Adjusted EPS: $0.91 vs analyst estimates of $0.61 (48.3% beat)
- Operating Margin: 21.6%, down from 24.2% in the same quarter last year
- Market Capitalization: $892.4 million
"Our second quarter results reflect the continued execution of our long-term strategy to build a more diversified and innovative biopharmaceutical company. While we continued to navigate pricing and competitive dynamics across portions of our portfolio, we successfully achieved key goals including overall revenue growth, expansion of gross margins, meaningful launches of new products, and continued advancement from both our generic and proprietary development pipelines. These results demonstrate the strength of our integrated business model and position us well for long-term sustainable growth," said Dr. Jack Zhang, Amphastar's President and Chief Executive Officer.
Company Overview
Founded in 1996 and known for its expertise in complex drug formulations, Amphastar Pharmaceuticals (NASDAQ:AMPH) develops and manufactures technically challenging injectable and inhalation medications, including both generic and proprietary pharmaceutical products.
Revenue Growth
Examining a company’s long-term performance can provide clues about its quality. Any business can experience short-term success, but top-performing ones enjoy sustained growth for years. Luckily, Amphastar Pharmaceuticals’s sales grew at a solid 13.7% compounded annual growth rate over the last five years. Its growth beat the average healthcare company and shows its offerings resonate with customers.
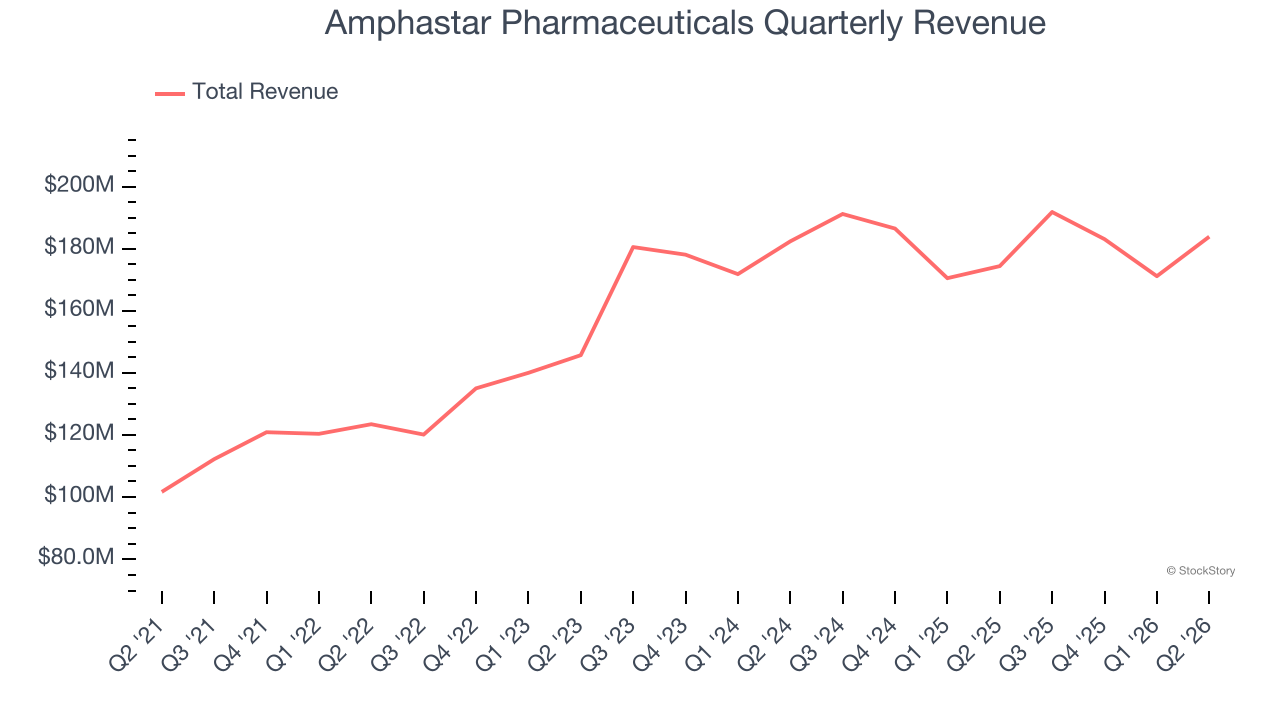
We at StockStory place the most emphasis on long-term growth, but within healthcare, a half-decade historical view may miss recent innovations or disruptive industry trends. Amphastar Pharmaceuticals’s recent performance shows its demand has slowed as its annualized revenue growth of 1.2% over the last two years was below its five-year trend. We’re wary when companies in the sector see decelerations in revenue growth, as it could signal changing consumer tastes aided by low switching costs. 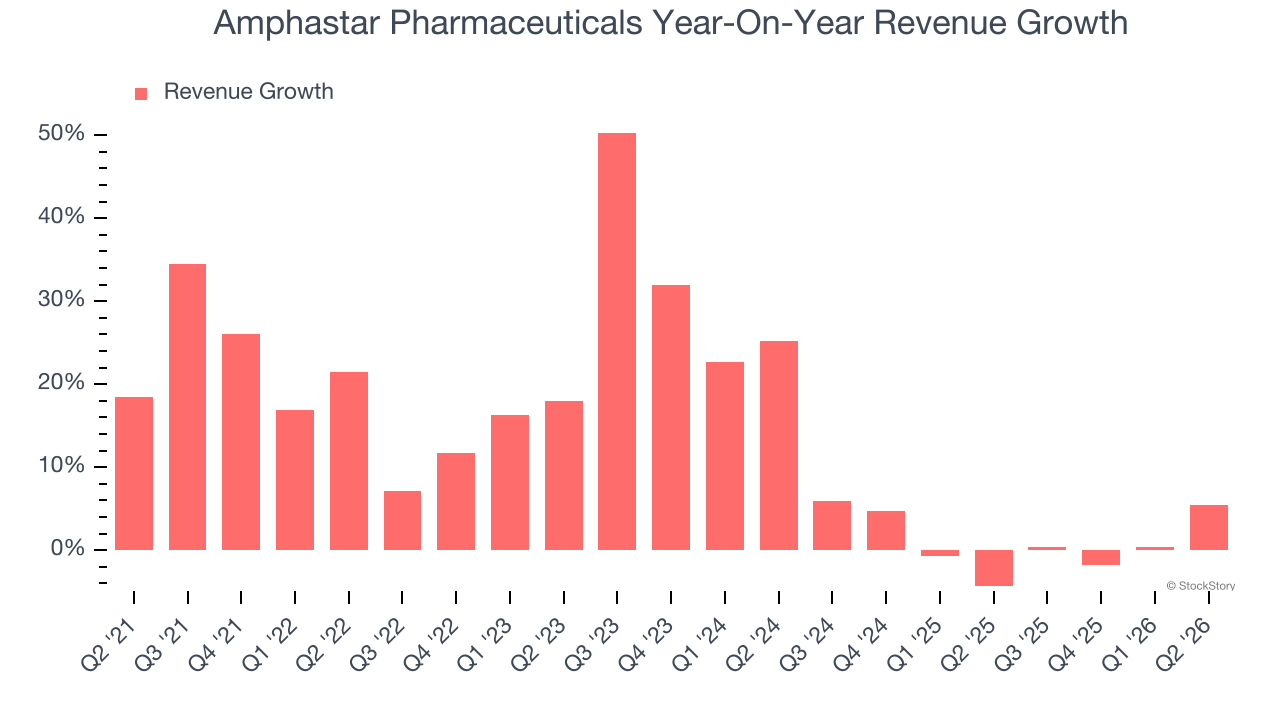
This quarter, Amphastar Pharmaceuticals reported year-on-year revenue growth of 5.4%, and its $183.9 million of revenue exceeded Wall Street’s estimates by 2%.
Looking ahead, sell-side analysts expect revenue to grow 4.6% over the next 12 months. While this projection implies its newer products and services will catalyze better top-line performance, it is still below the sector average.
ALSO WORTH WATCHING: Nvidia’s Quiet Partner. Nvidia’s chips cost a hundred grand. The connectors that make them work cost even more. One company makes them all.
Every AI server needs specialized infrastructure the chip companies don’t make. High-speed cables. Power connectors. Thermal sensors. This 90-year-old company built a monopoly on it. The AI boom just started. This stock is still flying under the radar. Claim The Stock Ticker Here for FREE.
Adjusted Operating Margin
Amphastar Pharmaceuticals has been a well-oiled machine over the last five years. It demonstrated elite profitability for a healthcare business, boasting an average adjusted operating margin of 30.4%.
Analyzing the trend in its profitability, Amphastar Pharmaceuticals’s adjusted operating margin rose by 1.6 percentage points over the last five years, as its sales growth gave it operating leverage. Zooming into its more recent performance, however, we can see the company’s margin has decreased by 13.5 percentage points on a two-year basis. If Amphastar Pharmaceuticals wants to pass our bar, it must prove it can expand its profitability consistently.
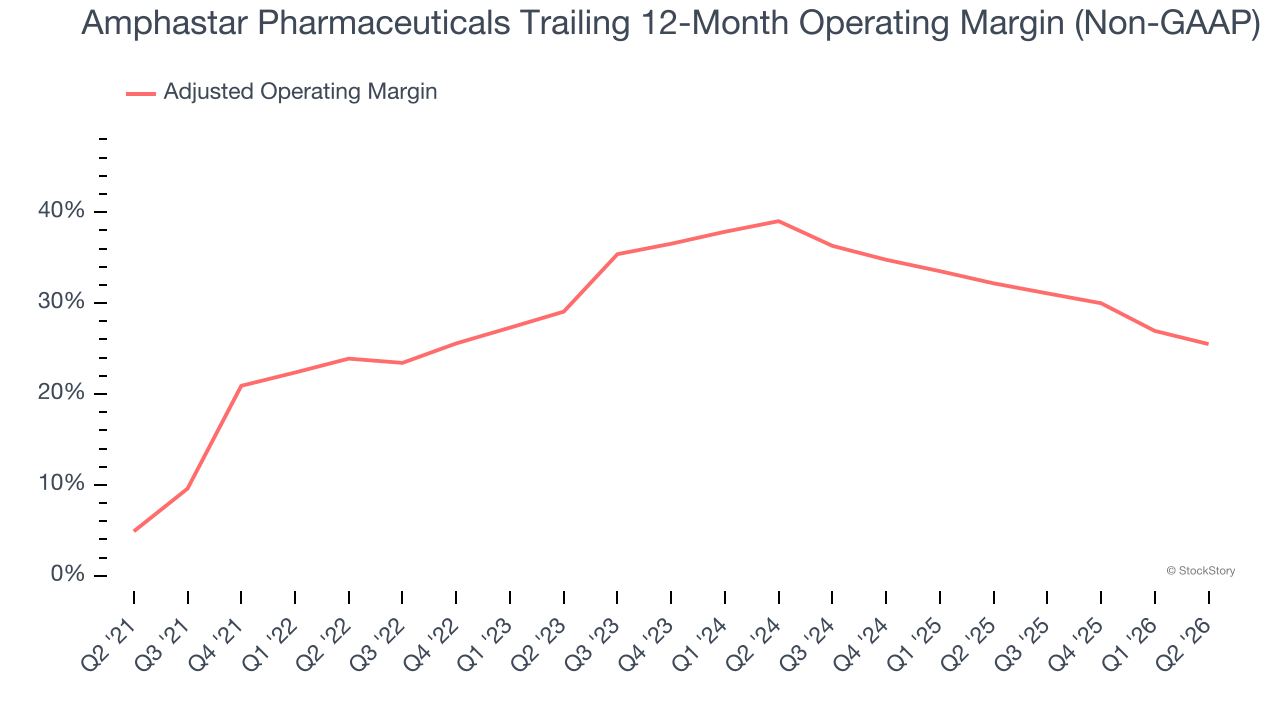
This quarter, Amphastar Pharmaceuticals generated an adjusted operating margin profit margin of 25.5%, down 6 percentage points year on year. This contraction shows it was less efficient because its expenses grew faster than its revenue.
Earnings Per Share
We track the long-term change in earnings per share (EPS) for the same reason as long-term revenue growth. Compared to revenue, however, EPS highlights whether a company’s growth is profitable.
Amphastar Pharmaceuticals’s EPS grew at 30.5% compounded annual growth rate over the last five years, higher than its 13.7% annualized revenue growth. This tells us the company became more profitable on a per-share basis as it expanded.
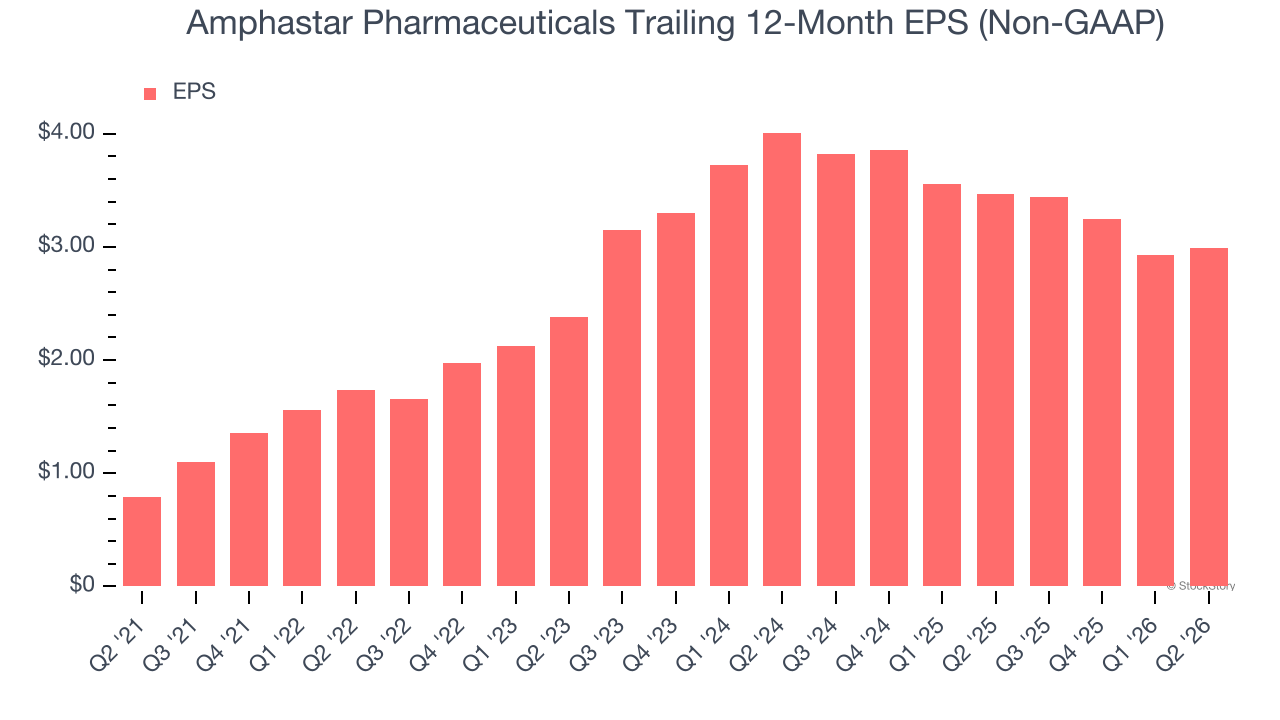
Diving into the nuances of Amphastar Pharmaceuticals’s earnings can give us a better understanding of its performance. As we mentioned earlier, Amphastar Pharmaceuticals’s adjusted operating margin declined this quarter but expanded by 1.6 percentage points over the last five years. Its share count also shrank by 10.8%, and these factors together are positive signs for shareholders because improving profitability and share buybacks turbocharge EPS growth relative to revenue growth. 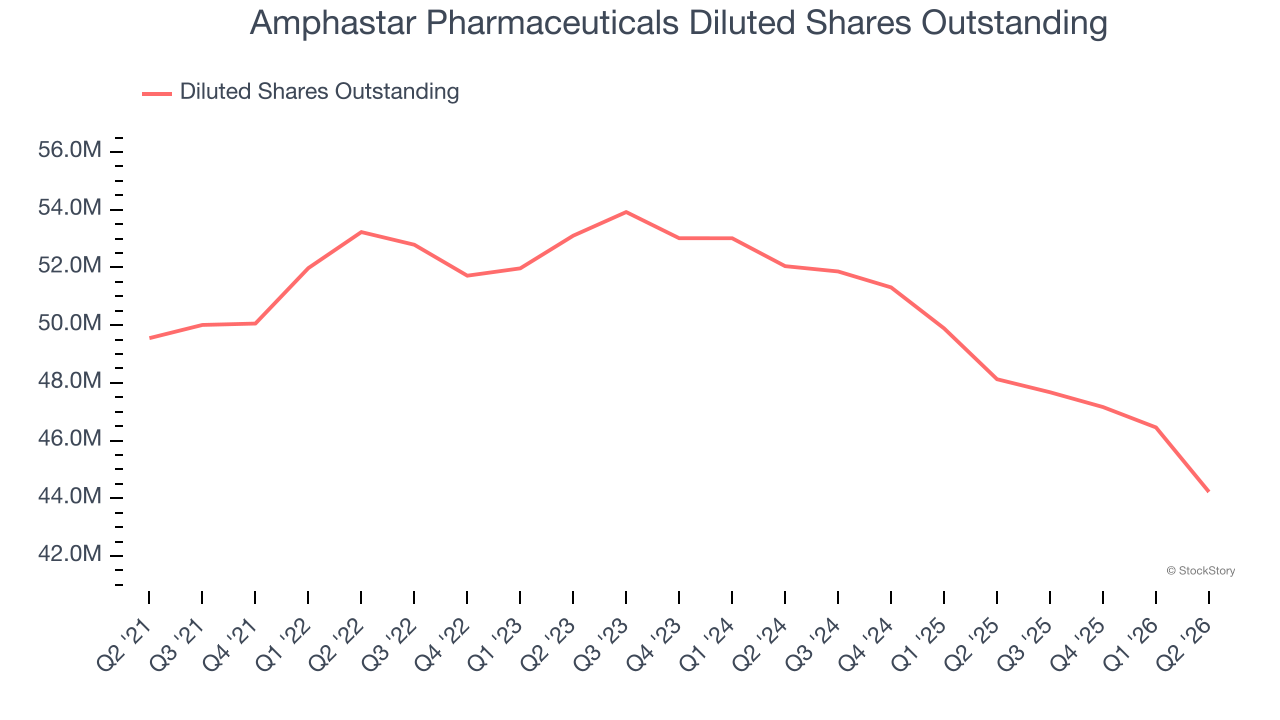
In Q2, Amphastar Pharmaceuticals reported adjusted EPS of $0.91, up from $0.85 in the same quarter last year. This print easily cleared analysts’ estimates, and shareholders should be content with the results. Over the next 12 months, Wall Street expects Amphastar Pharmaceuticals’s full-year EPS to shrink by 5.7% from $2.99 to $2.82.
Key Takeaways from Amphastar Pharmaceuticals’s Q2 Results
It was good to see Amphastar Pharmaceuticals beat analysts’ EPS expectations this quarter. We were also happy its revenue outperformed Wall Street’s estimates. Zooming out, we think this quarter featured some important positives. The stock traded up 4.5% to $20.70 immediately after reporting.
Indeed, Amphastar Pharmaceuticals had a rock-solid quarterly earnings result, but is this stock a good investment here? If you’re making that decision, you should consider the bigger picture of valuation, business qualities, as well as the latest earnings. We cover that in our actionable full research report which you can read here (it’s free).