

Exercise equipment company Peloton (NASDAQ:PTON) reported revenue ahead of Wall Street’s expectations in Q1 CY2026, with sales up 1.1% year on year to $630.9 million. The company expects the full year’s revenue to be around $2.43 billion, close to analysts’ estimates. Its GAAP profit of $0.06 per share was $0.02 below analysts’ consensus estimates.
Is now the time to buy Peloton? Find out by accessing our full research report, it’s free.
Peloton (PTON) Q1 CY2026 Highlights:
- Revenue: $630.9 million vs analyst estimates of $618.1 million (1.1% year-on-year growth, 2.1% beat)
- EPS (GAAP): $0.06 vs analyst estimates of $0.08 ($0.02 miss)
- Adjusted EBITDA: $126.2 million vs analyst estimates of $129 million (20% margin, 2.2% miss)
- The company slightly lifted its revenue guidance for the full year to $2.43 billion at the midpoint from $2.42 billion
- EBITDA guidance for the full year is $475 million at the midpoint, below analyst estimates of $485.6 million
- Operating Margin: 8.3%, up from -5.2% in the same quarter last year
- Free Cash Flow Margin: 23.9%, up from 15.2% in the same quarter last year
- Connected Fitness Subscribers: down 218,000 year on year
- Market Capitalization: $2.21 billion
Company Overview
Started as a Kickstarter campaign, Peloton (NASDAQ: PTON) is a fitness technology company known for its at-home exercise equipment and interactive online workout classes.
Revenue Growth
Examining a company’s long-term performance can provide clues about its quality. Any business can experience short-term success, but top-performing ones enjoy sustained growth for years. Peloton’s demand was weak over the last five years as its sales fell at a 7.9% annual rate. This wasn’t a great result and suggests it’s a low quality business.
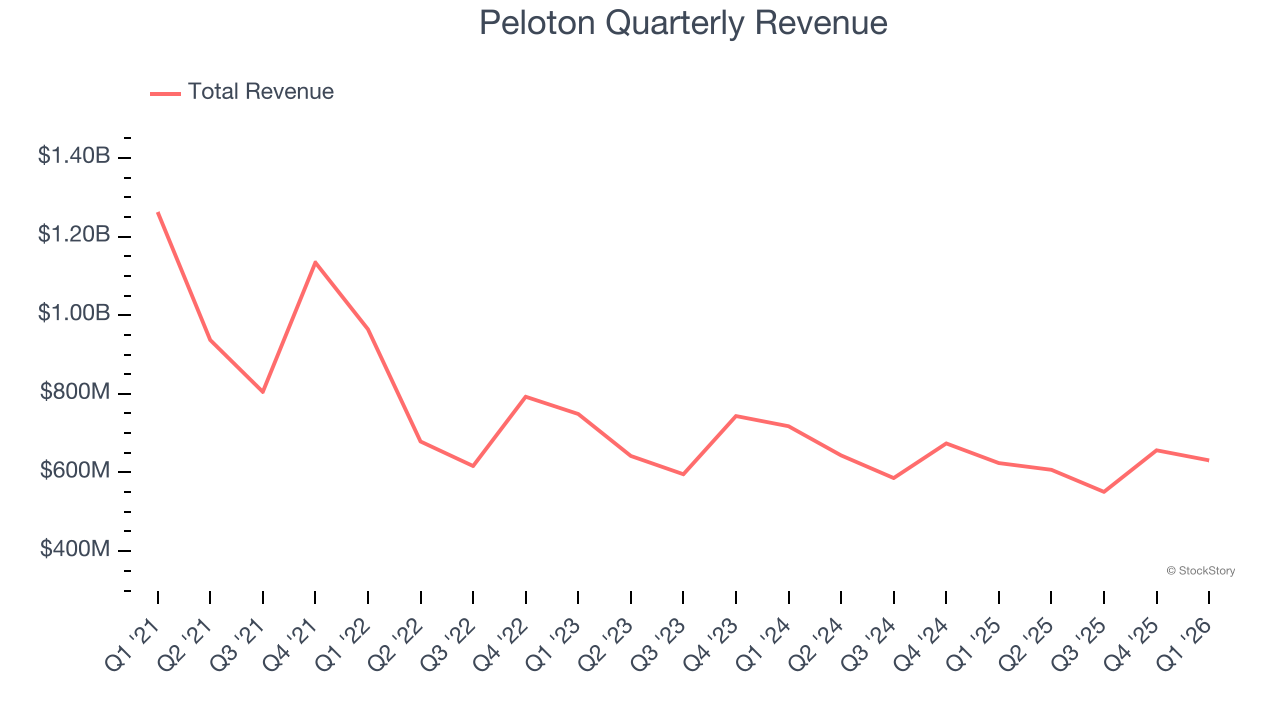
We at StockStory place the most emphasis on long-term growth, but within consumer discretionary, a stretched historical view may miss a company riding a successful new product or trend. Peloton’s annualized revenue declines of 4.8% over the last two years suggest its demand continued shrinking. 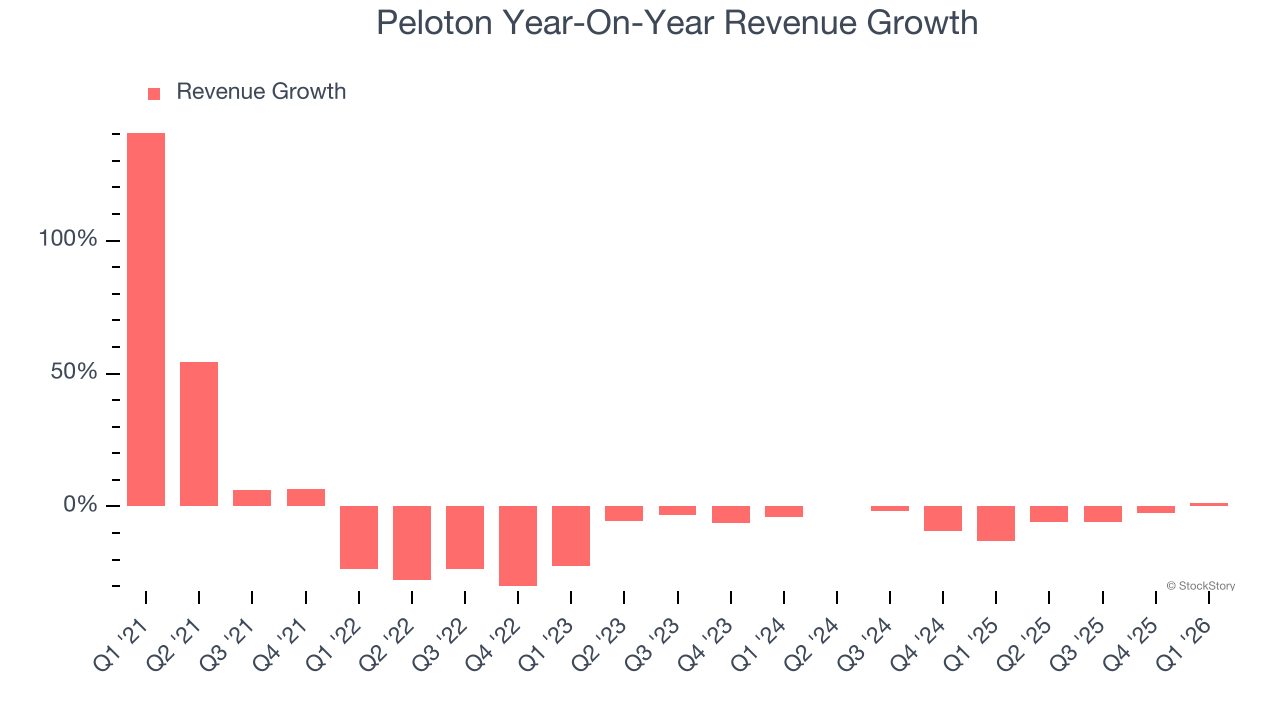
We can better understand the company’s revenue dynamics by analyzing its number of connected fitness subscribers, which reached 2.66 million in the latest quarter. Over the last two years, Peloton’s connected fitness subscribers averaged 4.5% year-on-year declines. Because this number aligns with its revenue growth during the same period, we can see the company’s monetization was fairly consistent. 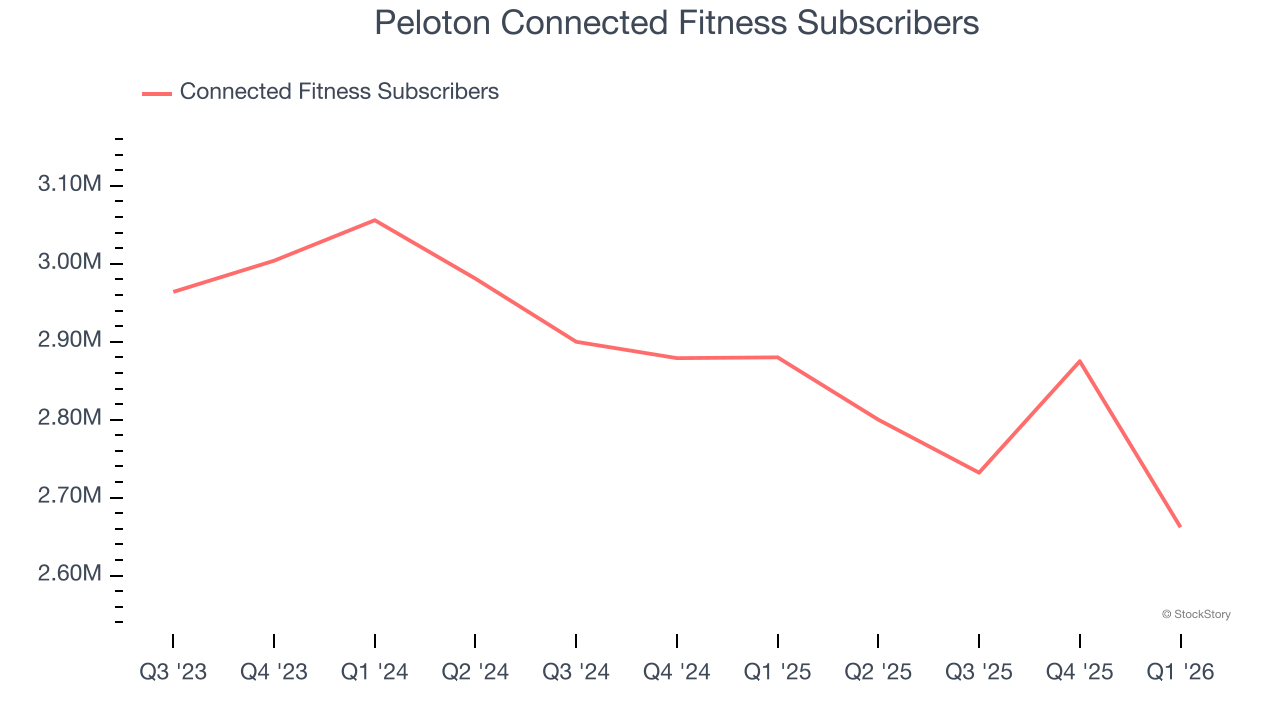
This quarter, Peloton reported modest year-on-year revenue growth of 1.1% but beat Wall Street’s estimates by 2.1%.
Looking ahead, sell-side analysts expect revenue to remain flat over the next 12 months. Although this projection indicates its newer products and services will fuel better top-line performance, it is still below the sector average.
ALSO WORTH WATCHING: Nvidia’s Quiet Partner. Nvidia’s chips cost a hundred grand. The connectors that make them work cost even more. One company makes them all.
Every AI server needs specialized infrastructure the chip companies don’t make. High-speed cables. Power connectors. Thermal sensors. This 90-year-old company built a monopoly on it. The AI boom just started. This stock is still flying under the radar. Claim The Stock Ticker Here for FREE.
Operating Margin
Operating margin is an important measure of profitability as it shows the portion of revenue left after accounting for all core expenses – everything from the cost of goods sold to advertising and wages. It’s also useful for comparing profitability across companies with different levels of debt and tax rates because it excludes interest and taxes.
Peloton’s operating margin has risen over the last 12 months, leading to break even profits over the last two years. However, its large expense base and inefficient cost structure mean it still sports inadequate profitability for a consumer discretionary business.
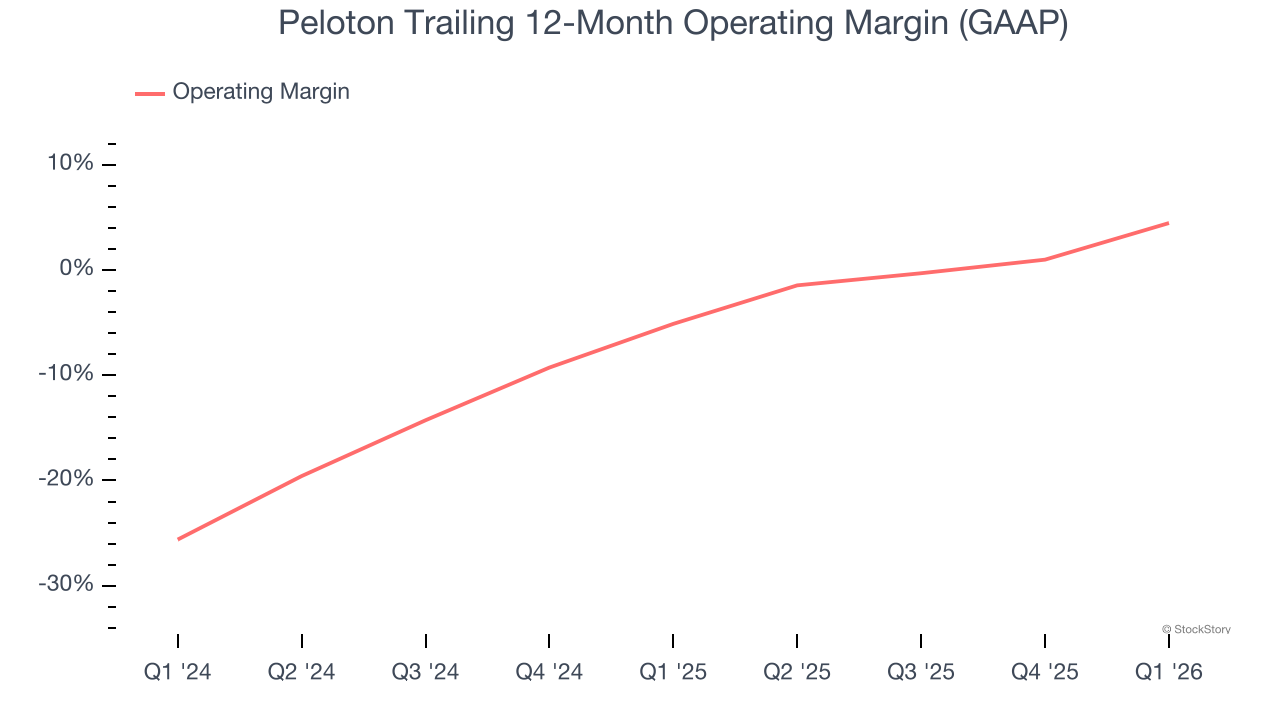
This quarter, Peloton generated an operating margin profit margin of 8.3%, up 13.5 percentage points year on year. This increase was a welcome development and shows it was more efficient.
Earnings Per Share
We track the long-term change in earnings per share (EPS) for the same reason as long-term revenue growth. Compared to revenue, however, EPS highlights whether a company’s growth is profitable.
Sadly for Peloton, its EPS declined by 41% annually over the last five years, more than its revenue. However, its operating margin actually improved during this time, telling us that non-fundamental factors such as interest expenses and taxes affected its ultimate earnings.
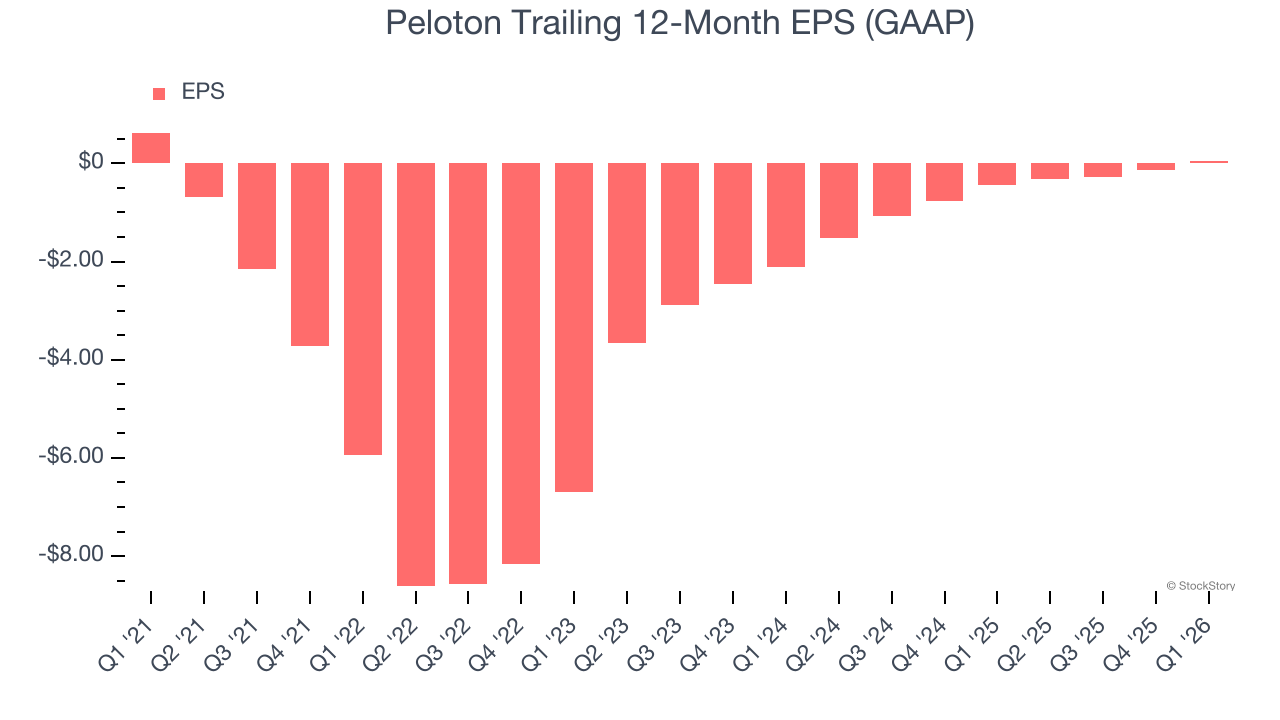
In Q1, Peloton reported EPS of $0.06, up from negative $0.12 in the same quarter last year. Despite growing year on year, this print missed analysts’ estimates. Over the next 12 months, Wall Street expects Peloton’s full-year EPS of $0.04 to grow 680%.
Key Takeaways from Peloton’s Q1 Results
We were impressed by how significantly Peloton blew past analysts’ adjusted operating income expectations this quarter. We were also happy its revenue outperformed Wall Street’s estimates. On the other hand, its EPS was in line and its full-year EBITDA guidance fell short of Wall Street’s estimates. Overall, this was a softer quarter. The stock traded up 2.6% to $5.33 immediately following the results.
Big picture, is Peloton a buy here and now? If you’re making that decision, you should consider the bigger picture of valuation, business qualities, as well as the latest earnings. We cover that in our actionable full research report which you can read here (it’s free).