

Financial services company Truist Financial (NYSE:TFC) met Wall Street’s revenue expectations in Q2 CY2025, with sales up 396% year on year to $4.99 billion. Its non-GAAP profit of $0.91 per share was 1.8% below analysts’ consensus estimates.
Is now the time to buy Truist Financial? Find out by accessing our full research report, it’s free.
Truist Financial (TFC) Q2 CY2025 Highlights:
- Net Interest Income: $3.59 billion vs analyst estimates of $3.61 billion (1.8% year-on-year growth, in line)
- Net Interest Margin: 3% vs analyst estimates of 3% (flat year on year, 2.6 bps miss)
- Revenue: $4.99 billion vs analyst estimates of $4.98 billion (in line)
- Efficiency Ratio: 59.9% vs analyst estimates of 57.6% (2.3 percentage point miss)
- Adjusted EPS: $0.91 vs analyst expectations of $0.93 (1.8% miss)
- Market Capitalization: $58.94 billion
Company Overview
Born from the 2019 merger of BB&T and SunTrust in one of the largest banking combinations since the 2008 financial crisis, Truist Financial (NYSE:TFC) is a bank holding company that offers a wide range of financial services including consumer and commercial banking, wealth management, insurance, and lending solutions.
Sales Growth
Two primary revenue streams drive bank earnings. While net interest income, which is earned by charging higher rates on loans than paid on deposits, forms the foundation, fee-based services across banking, credit, wealth management, and trading operations provide additional income.
Unfortunately, Truist Financial’s 2.2% annualized revenue growth over the last five years was tepid. This was below our standards and is a poor baseline for our analysis.

Note: Quarters not shown were determined to be outliers, impacted by outsized investment gains/losses that are not indicative of the recurring fundamentals of the business.Long-term growth is the most important, but within financials, a half-decade historical view may miss recent interest rate changes and market returns. Truist Financial’s performance shows it grew in the past but relinquished its gains over the last two years, as its revenue fell by 5.3% annually.
Note: Quarters not shown were determined to be outliers, impacted by outsized investment gains/losses that are not indicative of the recurring fundamentals of the business.
This quarter, Truist Financial’s $4.99 billion of revenue was in line with Wall Street’s estimates.
Net interest income made up 54.7% of the company’s total revenue during the last five years, meaning Truist Financial’s growth drivers strike a balance between lending and non-lending activities.
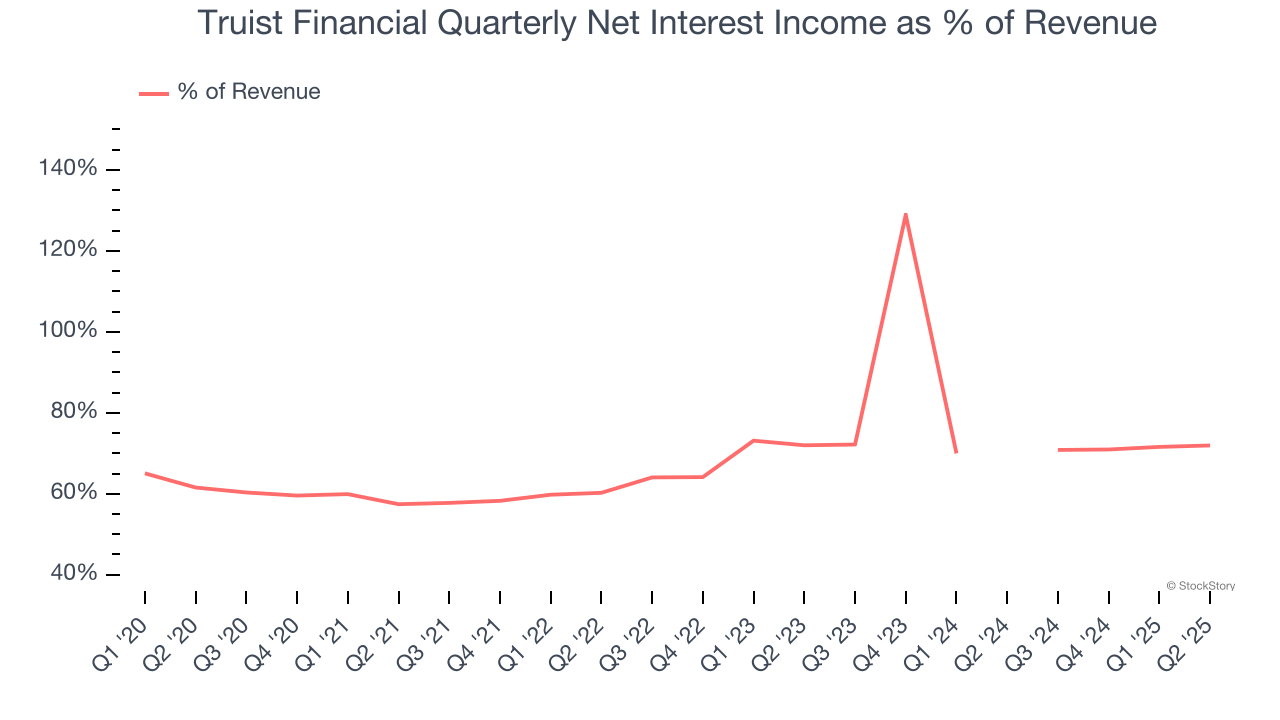
Note: Quarters not shown were determined to be outliers, impacted by outsized investment gains/losses that are not indicative of the recurring fundamentals of the business.
While banks generate revenue from multiple sources, investors view net interest income as the cornerstone - its predictable, recurring characteristics stand in sharp contrast to the volatility of non-interest income.
Unless you’ve been living under a rock, it should be obvious by now that generative AI is going to have a huge impact on how large corporations do business. While Nvidia and AMD are trading close to all-time highs, we prefer a lesser-known (but still profitable) stock benefiting from the rise of AI. Click here to access our free report one of our favorites growth stories.
Tangible Book Value Per Share (TBVPS)
The balance sheet drives banking profitability since earnings flow from the spread between borrowing and lending rates. As such, valuations for these companies concentrate on capital strength and sustainable equity accumulation potential.
Because of this, tangible book value per share (TBVPS) emerges as the critical performance benchmark. By excluding intangible assets with uncertain liquidation values, this metric captures real, liquid net worth per share. Other (and more commonly known) per-share metrics like EPS can sometimes be murky due to M&A or accounting rules allowing for loan losses to be spread out.
Truist Financial’s TBVPS grew at a mediocre 4.2% annual clip over the last five years. However, TBVPS growth has accelerated recently, growing by 26.2% annually over the last two years from $19.85 to $31.63 per share.
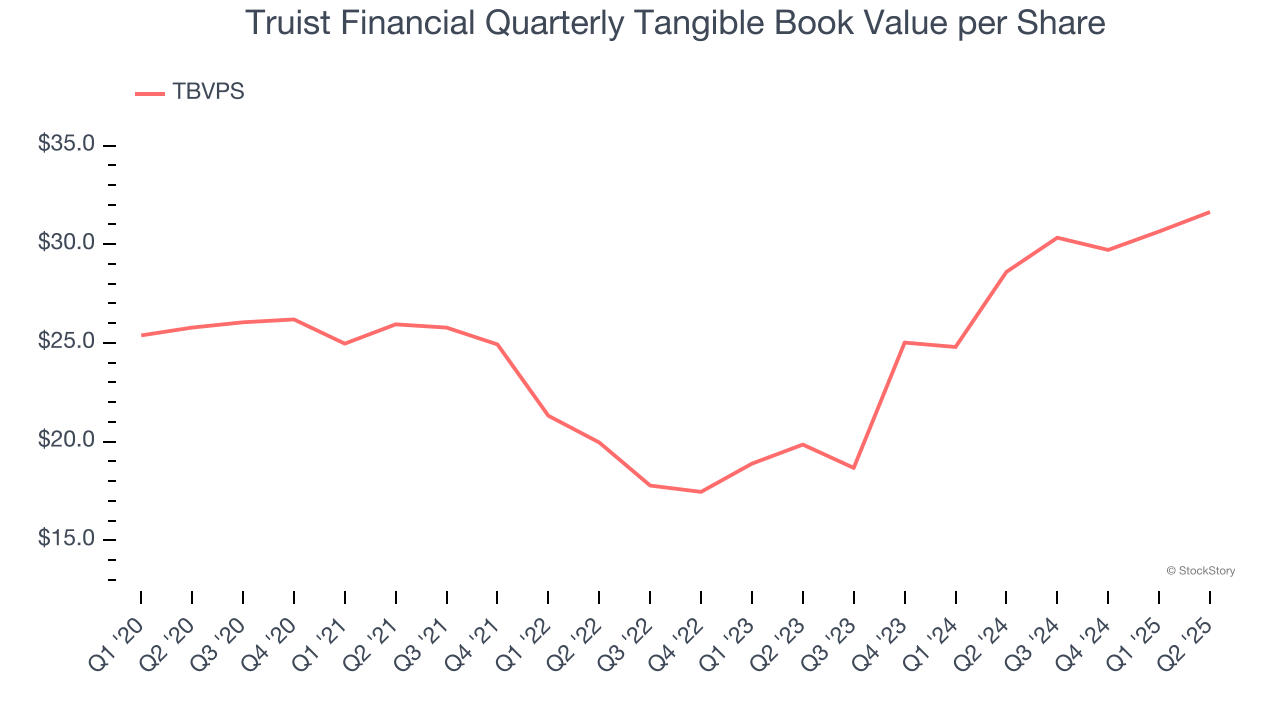
Over the next 12 months, Consensus estimates call for Truist Financial’s TBVPS to grow by 5.2% to $33.28, mediocre growth rate.
Key Takeaways from Truist Financial’s Q2 Results
It was encouraging to see Truist Financial beat analysts’ tangible book value per share expectations this quarter. On the other hand, its EPS missed and its net interest income was in line with Wall Street’s estimates. Overall, this quarter was mixed. The stock remained flat at $44.78 immediately following the results.
Truist Financial didn’t show it’s best hand this quarter, but does that create an opportunity to buy the stock right now? When making that decision, it’s important to consider its valuation, business qualities, as well as what has happened in the latest quarter. We cover that in our actionable full research report which you can read here, it’s free.