

Composite decking and railing products manufacturer Trex Company (NYSE:TREX) reported Q1 CY2025 results topping the market’s revenue expectations, but sales fell by 9% year on year to $340 million. Its GAAP profit of $0.56 per share was 4.1% below analysts’ consensus estimates.
Is now the time to buy Trex? Find out by accessing our full research report, it’s free.
Trex (TREX) Q1 CY2025 Highlights:
- Revenue: $340 million vs analyst estimates of $328.4 million (9% year-on-year decline, 3.5% beat)
- EPS (GAAP): $0.56 vs analyst expectations of $0.58 (4.1% miss)
- Adjusted EBITDA: $95.91 million vs analyst estimates of $99.59 million (28.2% margin, 3.7% miss)
- Operating Margin: 24%, down from 31.9% in the same quarter last year
- Free Cash Flow was -$79.49 million compared to -$211.8 million in the same quarter last year
- Market Capitalization: $6.06 billion
“First quarter sales exceeded our expectations driven by the continued strength of our premium products and our prominent position in both retail and the pro-channel,” said Bryan Fairbanks, President and CEO.
Company Overview
Addressing the demand for aesthetically-pleasing and unique outdoor living spaces, Trex Company (NYSE:TREX) makes wood-alternative decking, railing, and patio furniture.
Sales Growth
Reviewing a company’s long-term sales performance reveals insights into its quality. Any business can put up a good quarter or two, but many enduring ones grow for years. Thankfully, Trex’s 7.8% annualized revenue growth over the last five years was decent. Its growth was slightly above the average industrials company and shows its offerings resonate with customers.
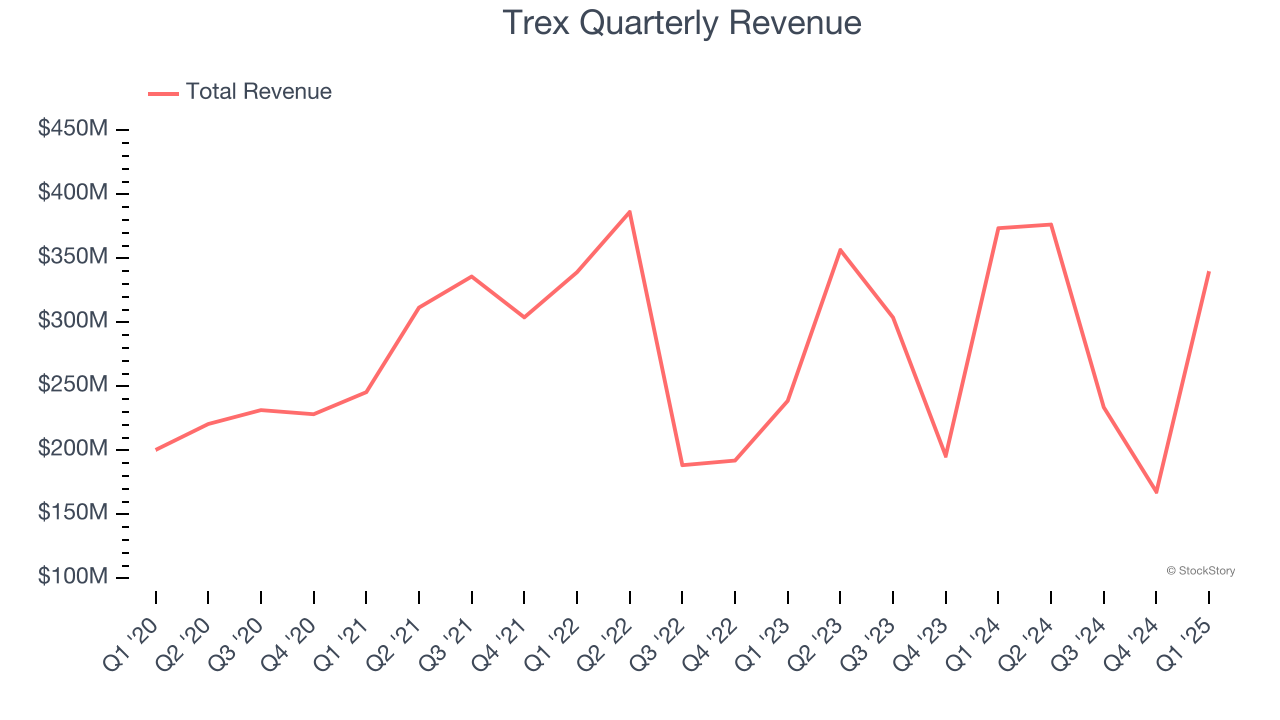
Long-term growth is the most important, but within industrials, a half-decade historical view may miss new industry trends or demand cycles. Trex’s recent performance shows its demand has slowed as its annualized revenue growth of 5.4% over the last two years was below its five-year trend. 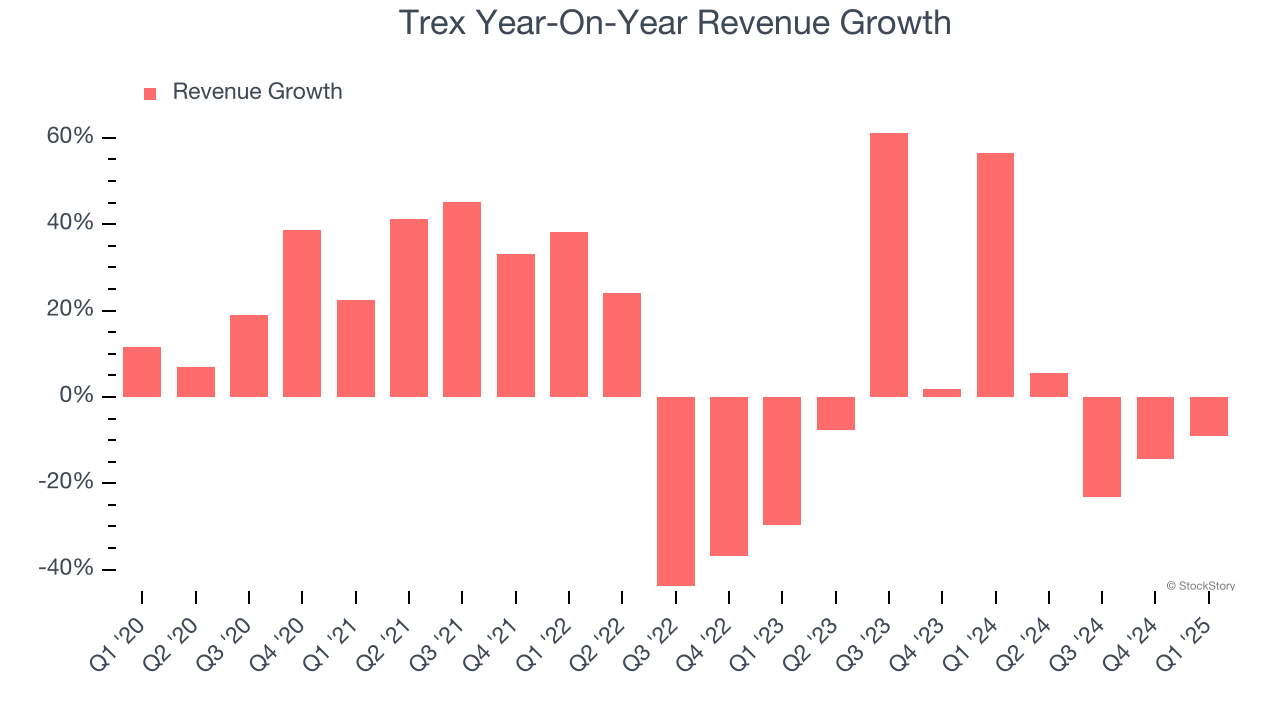
This quarter, Trex’s revenue fell by 9% year on year to $340 million but beat Wall Street’s estimates by 3.5%.
Looking ahead, sell-side analysts expect revenue to grow 10.8% over the next 12 months, an improvement versus the last two years. This projection is healthy and indicates its newer products and services will spur better top-line performance.
Here at StockStory, we certainly understand the potential of thematic investing. Diverse winners from Microsoft (MSFT) to Alphabet (GOOG), Coca-Cola (KO) to Monster Beverage (MNST) could all have been identified as promising growth stories with a megatrend driving the growth. So, in that spirit, we’ve identified a relatively under-the-radar profitable growth stock benefiting from the rise of AI, available to you FREE via this link.
Operating Margin
Trex has been a well-oiled machine over the last five years. It demonstrated elite profitability for an industrials business, boasting an average operating margin of 24.5%. This result isn’t surprising as its high gross margin gives it a favorable starting point.
Analyzing the trend in its profitability, Trex’s operating margin decreased by 2.2 percentage points over the last five years. This raises questions about the company’s expense base because its revenue growth should have given it leverage on its fixed costs, resulting in better economies of scale and profitability.
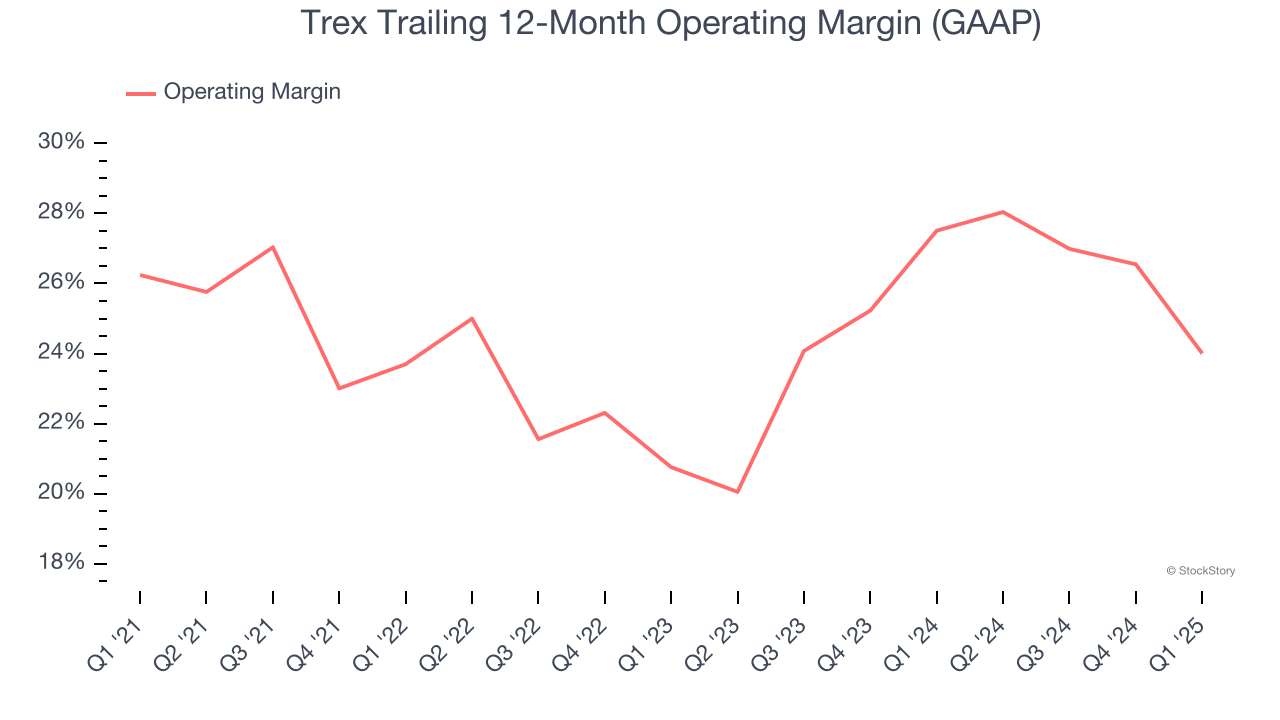
In Q1, Trex generated an operating profit margin of 24%, down 7.8 percentage points year on year. Since Trex’s operating margin decreased more than its gross margin, we can assume it was less efficient because expenses such as marketing, R&D, and administrative overhead increased.
Earnings Per Share
We track the long-term change in earnings per share (EPS) for the same reason as long-term revenue growth. Compared to revenue, however, EPS highlights whether a company’s growth is profitable.
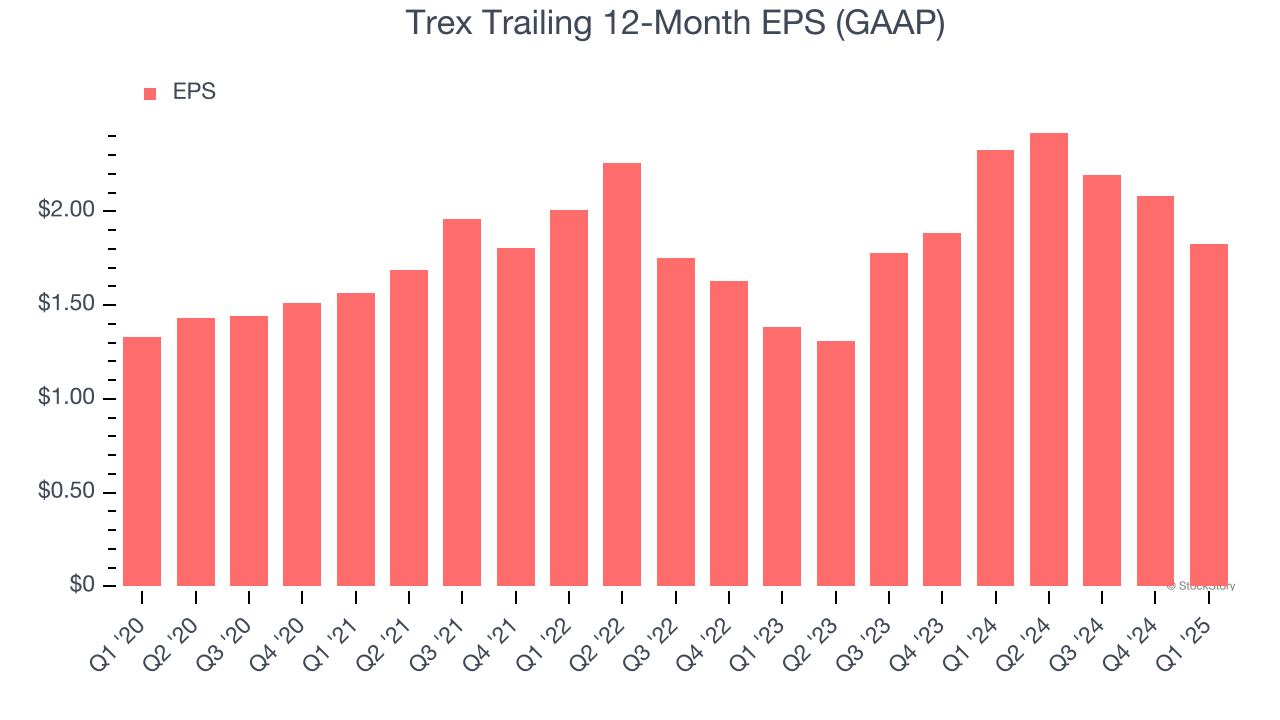
Trex’s EPS grew at an unimpressive 6.5% compounded annual growth rate over the last five years, lower than its 7.8% annualized revenue growth. This tells us the company became less profitable on a per-share basis as it expanded due to non-fundamental factors such as interest expenses and taxes.
Diving into the nuances of Trex’s earnings can give us a better understanding of its performance. As we mentioned earlier, Trex’s operating margin declined by 2.2 percentage points over the last five years. This was the most relevant factor (aside from the revenue impact) behind its lower earnings; taxes and interest expenses can also affect EPS but don’t tell us as much about a company’s fundamentals.
Like with revenue, we analyze EPS over a shorter period to see if we are missing a change in the business.
For Trex, its two-year annual EPS growth of 14.8% was higher than its five-year trend. This acceleration made it one of the faster-growing industrials companies in recent history.
In Q1, Trex reported EPS at $0.56, down from $0.82 in the same quarter last year. This print missed analysts’ estimates. Over the next 12 months, Wall Street expects Trex’s full-year EPS of $1.82 to grow 23.8%.
Key Takeaways from Trex’s Q1 Results
We were impressed by how significantly Trex blew past analysts’ revenue expectations this quarter. On the other hand, its EPS missed and its EBITDA fell short of Wall Street’s estimates. Overall, this was a softer quarter. The stock traded down 1.4% to $57.50 immediately after reporting.
The latest quarter from Trex’s wasn’t that good. One earnings report doesn’t define a company’s quality, though, so let’s explore whether the stock is a buy at the current price. What happened in the latest quarter matters, but not as much as longer-term business quality and valuation, when deciding whether to invest in this stock. We cover that in our actionable full research report which you can read here, it’s free.