For every watt invested in Gigamon, organizations save up to 11 watts or more in tool efficiencies, by significantly reducing the network data processing1
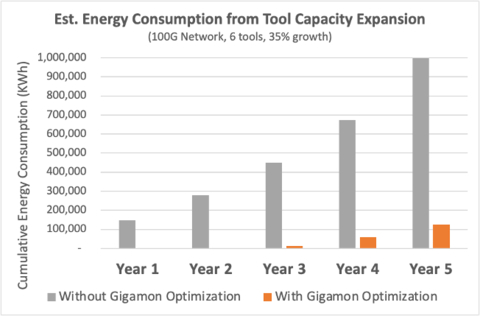
Gigamon, the leading deep observability company, today shares insights into its ability to enable customers to reduce the power consumption, carbon emissions, and energy costs of cloud, security and observability tools by as much as 87 percent over a five-year time horizon2. To further support customers in their efforts to best utilize their existing tools infrastructure, Gigamon today launched a free Energy Savings Calculator service as an extension of the Network Efficiency Appraisal Team and Gigamon Cost Savings Calculator for customers who want a personalized assessment of their energy reduction opportunities.
This press release features multimedia. View the full release here: https://www.businesswire.com/news/home/20230516005483/en/

Calculating Energy Savings from a Deep Observability Pipeline4 (Graphic: Business Wire)
Data centers and transmission networks account for 2–3 percent of global electricity use, emitting around 300 million metric tons of carbon dioxide (CO2)-equivalent emissions annually. Sustainability is no longer a nice-to-have for the global data center industry. Many organizations are taking action to reduce their carbon impact, starting with their data centers. In fact, dozens of technology companies have already achieved, or are planning to achieve, carbon neutrality by 2030.
“IT leaders must go beyond physical energy efficiency and proactively seek ways to realize efficiencies at the architectural level within and across their hybrid infrastructure,” said Simon Leopold, managing director of Data Infrastructure Equity Research at Raymond James and Associates, Inc. “Gigamon can help its customers to reduce energy usage by working smarter, which can drive cost savings and achieve carbon goals. Gigamon Deep Observability Pipeline is an example of the kind of solution enabling organizations to address the need to be green while bolstering their bottom line.”
The Gigamon Energy Savings Calculator allows organizations to input existing hybrid cloud infrastructure parameters, including the volume of network traffic sent to tools and the annual growth rate in network traffic to see where energy efficiencies are achievable. Inputting this information enables IT teams to calculate the corresponding cost savings and reduced carbon footprint that is unique to their network environment and tooling.
“Reducing data center power consumption and carbon emissions is a shared responsibility as IT leaders shift toward more sustainable operations while doing their part to move us all toward carbon neutrality,” said Michael Dickman, chief product officer at Gigamon. “It’s an enormous undertaking and we are incredibly proud of our ability to help customers to not only realize significant costs savings, but also participate in more eco-friendly business practices which is ultimately a win/win for all of us.”
The Gigamon Deep Observability Pipeline enables organizations to leverage a combination of application filtering, de-duplication, application metadata, and flow mapping and slicing to dramatically reduce the volume of network traffic sent to tools for analysis. In fact, organizations that leverage the deep observability pipeline can generate a 95 percent reduction in traffic for certain, more complex tools. And other tools that require visibility into all traffic can experience a 25 percent reduction in traffic through the modest use of filtering3.
Fn. 1-3. For more information on the value of data center carbon reduction, please visit the Gigamon blog or read our white paper: “Beyond the Physical Plant, Reduce Energy Usage Before it Begins”. If you’re interested in seeing an energy savings or cost savings model for your tools, contact the Gigamon Network Efficiency Appraisal Team at NEAT@Gigamon.com.
*The calculator models electricity consumed (kWh), carbon dioxide emissions (CO2e), and utility energy costs (USD). Default values are provided for the conversion of kWh to CO2e, but users can also enter your known CO2e ratio to customize energy usage and costs.
About Gigamon
Gigamon® offers a deep observability pipeline that harnesses actionable network-derived intelligence to amplify the power of observability tools. This powerful combination helps enable IT organizations to assure security and compliance governance, speed root-cause analysis of performance bottlenecks, and lower operational overhead associated with managing hybrid and multi-cloud IT infrastructure. The result: modern enterprises realize the full transformational promise of the cloud. Gigamon serves more than 4,000 customers worldwide, including over 80 percent of Fortune 100 enterprises, 9 of the 10 largest mobile network providers, and hundreds of governments and educational organizations worldwide. To learn more, please visit gigamon.com.
© 2023 Gigamon. All rights reserved. Gigamon and the Gigamon logo are trademarks of Gigamon in the United States and/or other countries. Gigamon trademarks can be found at www.gigamon.com/legal-trademarks. All other trademarks are the property of their respective owners.
View source version on businesswire.com: https://www.businesswire.com/news/home/20230516005483/en/
Contacts
Gigamon Media:
public.relations@gigamon.com
