
Well, I didn’t have that one on my bingo card. The market capitalization for drug maker Eli Lilly (LLY) crossed $1 trillion.
This is quite a feat, considering that the trillion-dollar club tends to be exclusively for tech stocks. But in developing and marketing drugs for obesity (Zepbound) and diabetes (Mounjaro) the past few years, it can be said that LLY’s own technology in the lab allowed it to break through.
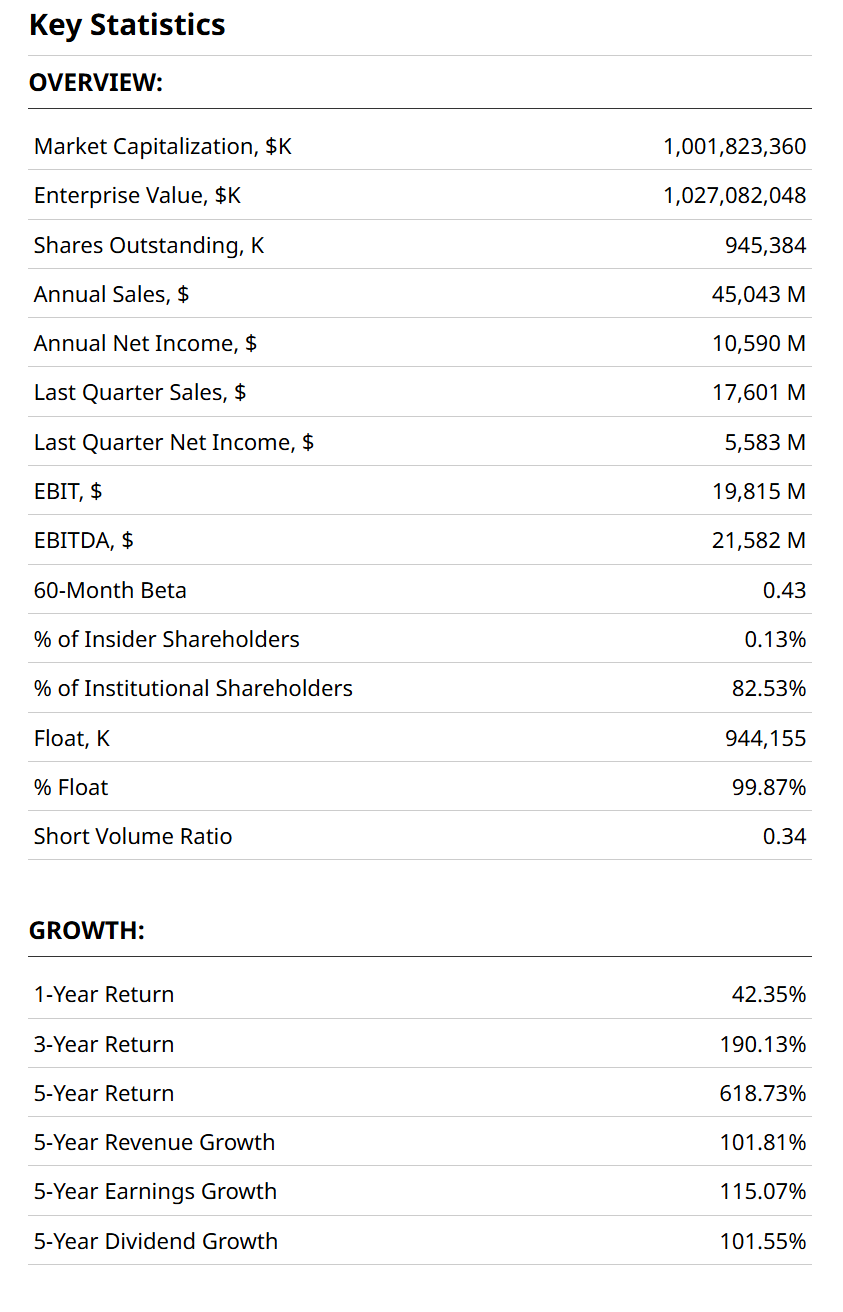
Of course, when a stock is up big (more than 600% the past 5 years in this case) as LLY is, we have to take a step back and revisit things. After all, this is not a fly-by-night business. Next year, the company founded by a Civil War veteran who also happened to be a chemist, will celebrate its 150th birthday.
In 2025, the stock of the Indianapolis-based company raced to new highs like an Indy Car in early May. But that makes risk managers like me ask a few questions. For instance:
- Is there a valuation risk, or is this just rewarding the company for the start of a long-term era of dominance on the back of these solutions to critical human issues?
- Does the stock deserve to be treated like a go-go growth stock, or is it just another mo-mo (momentum) trade that will only last as long as a strong market?
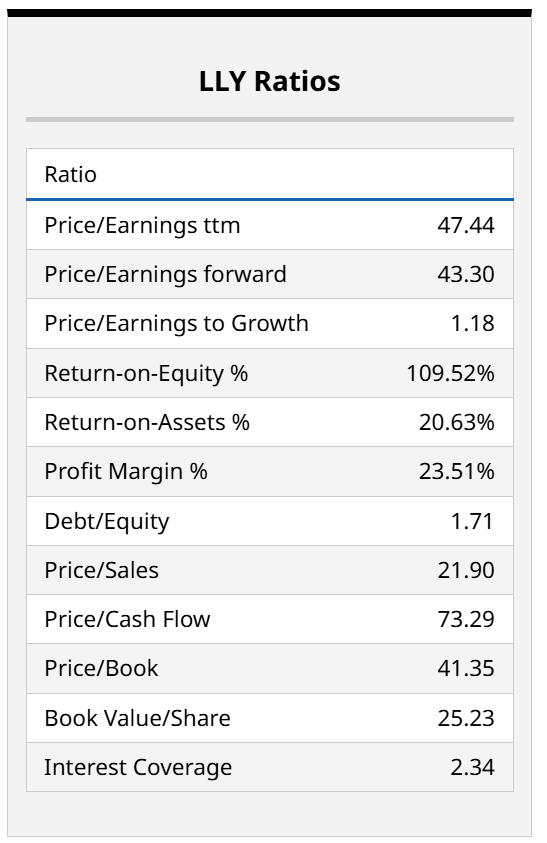
As we see below, LLY sells for 43x forward earnings, only 1.18x its growth rate. And, 22x sales. So it isn’t cheap on traditional metrics.
What Does LLY’s Chart Look Like?
In a word, awesome. If we’re looking backwards. But technical analysis is not about patting ourselves on the back. Even if an investor has taken that ride, we can see that as with any stock, there are gyrations.

Just in the past year, LLY traded between about $600 and $900 a share. It all worked out just fine, but to think there won’t be shocks to the stock on a regular basis would be to ignore market realities.
In other words, even if there’s a lot more upside here, the downside risk is higher than it has been. The Percentage Price Oscillator (PPO) indicator at bottom is already signalling that, given how elevated it is.
And in this weekly chart, we can also see how the stock burst through a potential bottleneck at below $1,000 in share, just a few weeks ago. That propelled LLY into the $1 trillion club. But now what?

At this point in the analysis, I will give my traditional response to the question, “what will the stock do next?” That response? I have no idea! Sure, risk is high, but that only means that if the stock does drop, there’s plenty of room to run lower. Especially at that valuation.
But if I’m in a stock like this, or an ETF for that matter, what I want at this stage is to protect most of my gains, but not get off the proverbial train.
Enter the collar. Because the best way I know to combine an elevated stock, a highly uncertain stock market, and my priority to avoid big risk is to collar the position.
Or, in the spirit of Thanksgiving week, where collared greens are a favorite side dish for many families, let’s take that LLY green and collar it. Here’s how.
What Could a LLY Collar Look Like?
As is typical for a liquid name like this one, there are many combinations of expiration date, strike price, and out of pocket cost. In this case, my goals were to get at least 2:1 upside to downside tradeoff, while keeping costs as close to neutral as possible. In other words, the cost to buy put protection was entirely offset by the dollars received from selling covered calls on that same stock.

The bottom line in the above is that my cost ended up being less than zero. That is, my account would receive about $6.55 a share, or $655 for 100 shares. The upside cap during the period to expiration, just over 12 months, is 13.4%, versus downside risk of only 5.3%. So about a 2.5 to 1 ratio. Not bad, I say.
Learning How to Use Options Collars Is Understanding the Tradeoffs
Note that with a stock whose price is this high, just owning 100 shares is a more than $100,000 proposition. But this is more about explaining the collar concept, as the basics apply to many stocks and ETFs. If you understand the math and the tradeoffs, you can find your own comfort zone with collars.
That allows us to turn any investment or trade into something that has reduced blowup risk, increased upside (because you might otherwise sell it and miss out), and most of all, control. Control over your destiny with that position, since you choose either your worst-case scenario, your upside limit, or both.
And there’s nothing stopping you from buying more stock if that upside cap reaches before expiration. It is as flexible as you want to make it. And with LLY and stocks like it, reaching heights few expected, I like the idea of controlling what I can.
On the date of publication, Rob Isbitts did not have (either directly or indirectly) positions in any of the securities mentioned in this article. All information and data in this article is solely for informational purposes. For more information please view the Barchart Disclosure Policy here.
More news from Barchart
- Eli Lilly’s Stock Price Has Fattened Up Like a Thanksgiving Turkey. Time to (Options) Collar That Green!
- Unusual Activity in Oracle Corp Put Options Highlights ORCL Stock's Value
- NVDA Broken Wing Butterfly Trade Targets A Profit Zone Between 165 and 175
- Lennar’s (LEN) Reality Looks Ugly—But Quant Traders Are Targeting THIS Options Spread