
Markets don’t move in a straight line. They move in ebbs and flows — tightening, expanding, compressing, exploding. The traders who recognize these volatility cycles early often catch the biggest moves before they happen.
That’s why the TTM Squeeze, a volatility-based breakout indicator originally popularized by John Carter, has become one of the most respected tools in modern technical analysis.
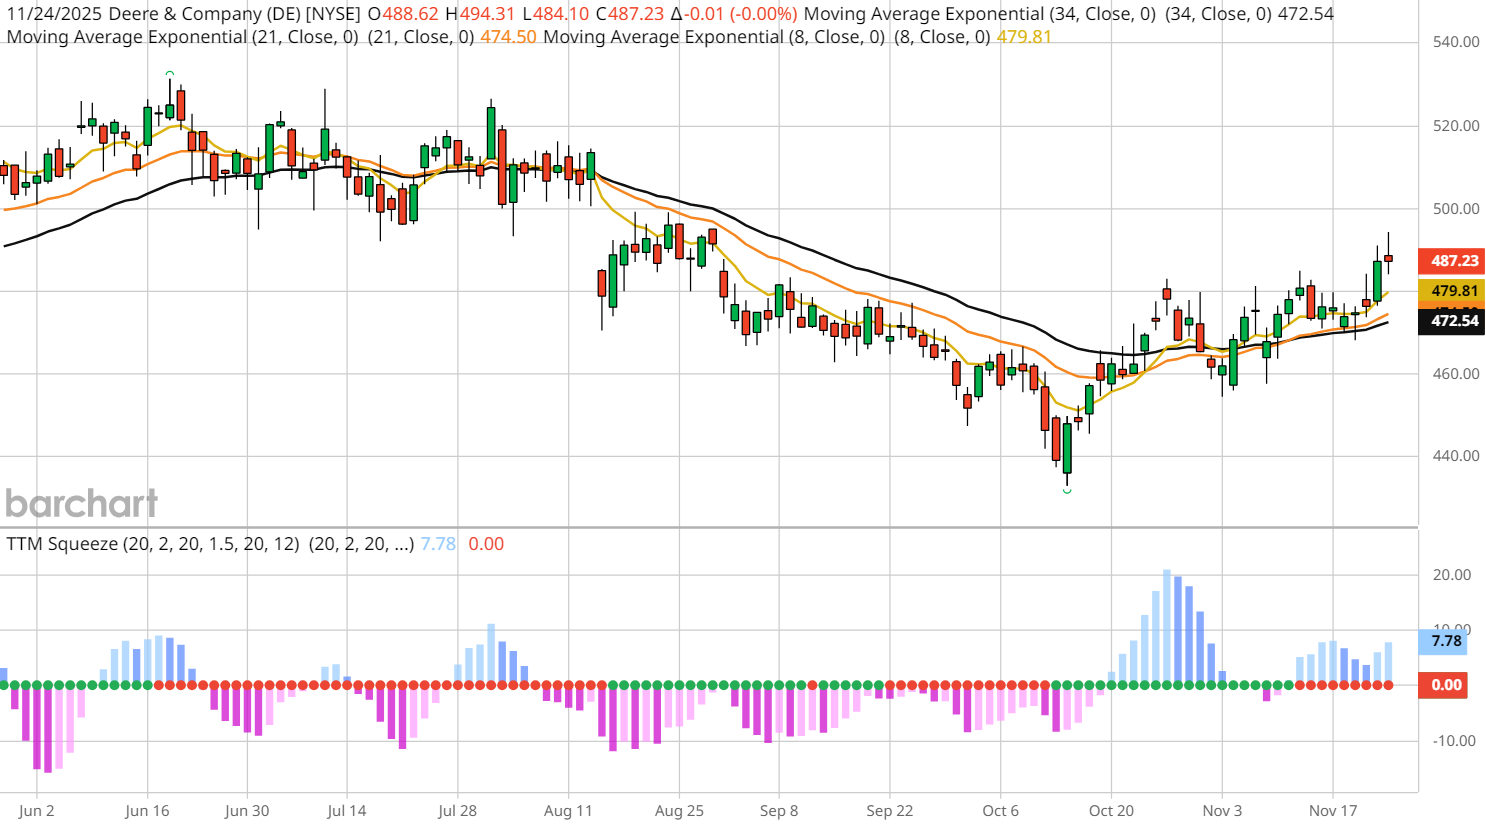
During a recent webinar, Barchart’s Senior Market Strategist John Rowland, CMT, shows exactly how to interpret the Squeeze using Barchart’s prebuilt chart templates. In this clip, he walks through the setup step-by-step — including the red “setup” dots, the green “firing” dot, and the momentum histogram that confirms trade direction.
Let’s break down how the Squeeze works and how to use it on Barchart to find real trading opportunities.
What the TTM Squeeze Actually Measures
Volatility cycles follow a simple pattern:
- Price consolidates
- Volatility contracts
- A breakout is coming — up or down
- Momentum determines direction
The Squeeze is built to detect that moment of compression using Bollinger Bands and Keltner Channels.
The TTM Squeeze chart template allows you to combine:
- Bollinger Bands (measuring volatility)
- Keltner Channels (measuring average range)
- A momentum histogram (showing directional strength)
- Three exponential moving averages – the 8, 21, and 34-unit EMAs – for trend confirmation
When the Bollinger Bands contract inside the Keltner Channels, red dots will appear on the TTM Squeeze to signal that the market is “coiling.” That’s your squeeze.
The Core Signals: Beginner-Friendly Breakdown
1. Red Dots = Price is Coiling
This is the compression phase. Bollinger Bands have moved inside the Keltner Channels.
That means volatility is drying up, and pressure is building. This period can last for one bar or many, but every red dot means the coil is tightening.
2. First Green Dot = “The Squeeze Fires”
This is the signal traders wait for.
The first green dot after the red sequence is the breakout trigger. It signals that volatility is expanding again.
But direction is determined by the histogram, which shows momentum.
3. Histogram Above Zero = Bullish Squeeze
Blue bars above zero tell you the breakout is most likely upward. This aligns with bullish momentum.
4. Histogram Below Zero = Bearish Squeeze
Purple bars below zero tell you the momentum favors a downside breakout.
Confirming Trades With Stacked EMAs
John Carter’s original system looks for:
- 8 EMA above the 21 EMA
- 21 EMA above the 34 EMA
- Price above all EMAs
This is called stacked EMAs — the strongest bullish confirmation.
For bearish squeezes, the price and moving average sequences would be reversed.
This simple filter helps traders avoid false signals and chase only the highest-quality breakouts.
Why the Squeeze Works So Well
The TTM Squeeze indicator works because markets naturally alternate between contraction and expansion.
A squeeze means:
- Lower volatility
- Tighter ranges
- Price holding within Keltner Channels
- Traders waiting for a breakout
- Institutions building positions
When the squeeze fires, it often marks the beginning of a new short-term trend. That’s the kind of signal that options traders love, because it gives clarity (direction + volatility expansion = opportunity).
How to Apply the Squeeze Using Barchart Tools
Start by adding the TTM Squeeze template to Interactive Charts. Then, layer on your go-to studies and tools like:
- Trend Seeker®
- Bollinger Bands
- RSI
Pairing these with the TTM Squeeze helps confirm breakouts and avoid false signals.
Then, scan for Squeeze setups with Barchart’s TTM Squeeze Screener, where you can filter by:
Use Options Data to Play Squeeze Breakouts
When a squeeze fires, options traders can consider:
- Long calls or call debit spreads for bullish breakouts
- Long puts or put debit spreads for bearish breakouts
- Iron condors or short straddles during extended red-dot compression
Barchart’s Options Screener can help traders drill down on the highest-probability contracts and strategies across both stocks and ETFs.
Why All of This Matters
This is one of the highest-value tools Barchart offers — especially for short-term traders, options traders, and swing traders.
If traders don’t understand the TTM Squeeze, they’re missing one of the best ways to anticipate big moves before the crowd.
Watch this clip to get started:
Stream the full Webinar: Power of the Squeeze – John Carter’s Secret Volatility Indicator Revealed
On the date of publication, Barchart Insights did not have (either directly or indirectly) positions in any of the securities mentioned in this article. All information and data in this article is solely for informational purposes. For more information please view the Barchart Disclosure Policy here.
More news from Barchart
- Find Breakout Stocks & Winning Option Trades with Our TTM Squeeze Lesson for Beginners
- Forget NVDA. This 1 Stronger Tech Stock Can Survive and Thrive in a Selloff. How to Trade It With Options Now.
- Down 11% Last Week, Should You Buy the Robinhood (HOOD) Discount? Here’s What You Need to Know
- Palo Alto Networks' Stock Has Tanked But Its FCF is Strong - Price Target is 15% Higher