
Few earnings announcements have the power to move global markets the way NVIDIA (NVDA) does, and this Wednesday’s post-close report might be the most important one of the year.
While Wall Street expects strong numbers again, Barchart’s Senior Market Strategist John Rowland, CMT, says the real story isn’t the last quarter’s performance… It’s the guidance.
“We’ll probably see good numbers,” John explains. “What I care about is their forward guidance — that’s what will move the market.”
Meanwhile, on NVDA’s stock chart, John is tracking a few key levels.
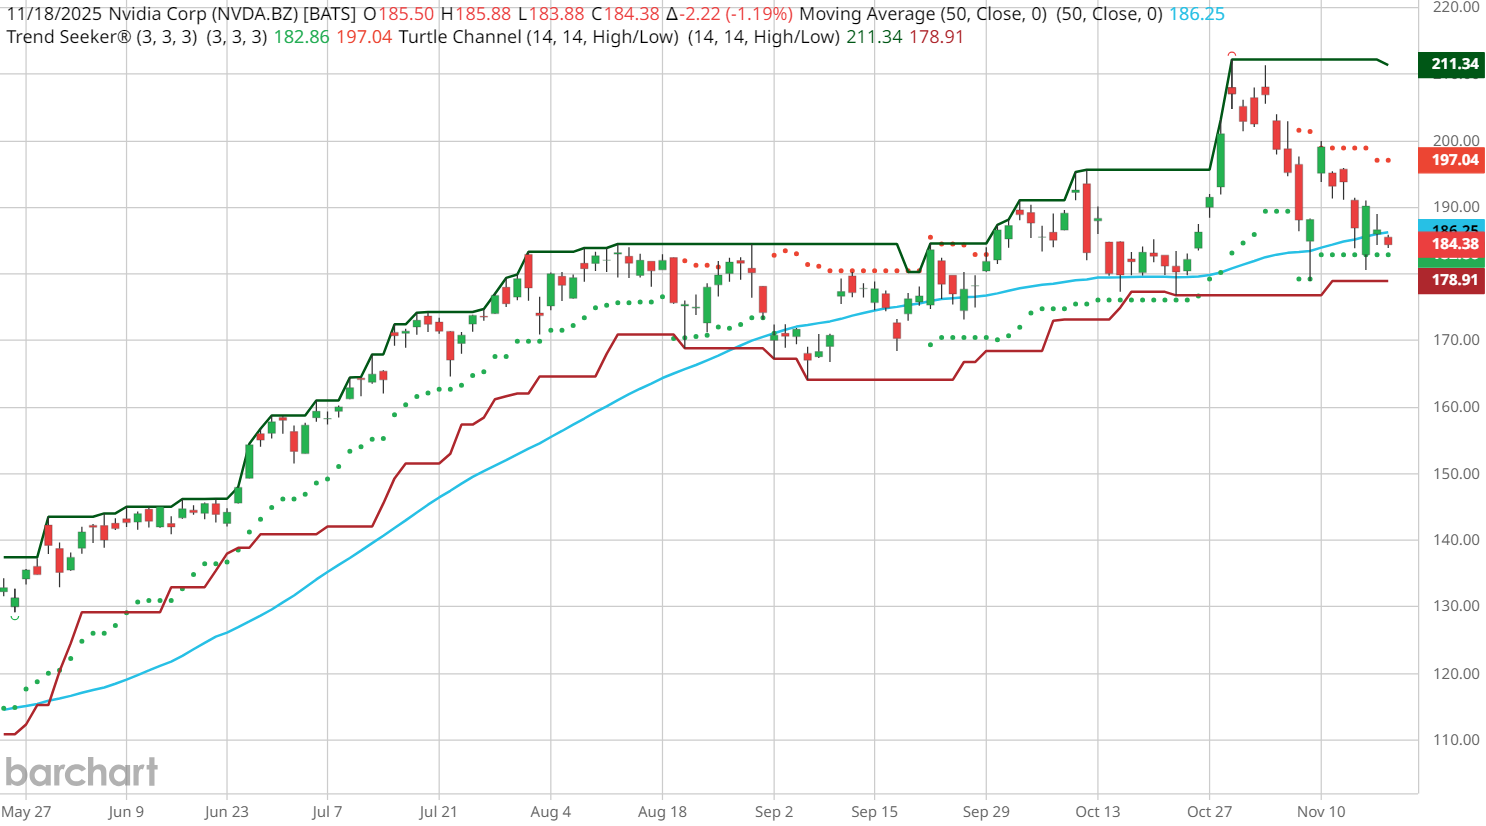
Barchart’s Trend Seeker® indicator — our proprietary trend-identification system — has shifted NVDA into a HOLD zone ahead of earnings. That’s rare, and it typically signals a market waiting for confirmation of the next major move.
The Trend Seeker Setup: A Hold Before a Break
For several sessions, Trend Seeker has printed two dots — one above and one below the current price. This signals a neutral/hold phase as the market compresses. It indicates that traders are waiting for a trigger, and a big move often follows.
The timing couldn’t be more explosive, with NVDA earnings set for Wednesday night.
Look at these key levels John highlighted:
- 50-day moving average: NVDA is sitting right on it
- Most recent flat Trend Seeker level: around $182
- Expected earnings move (11/21 expiration):
- Upside target: ~$198
- Downside target: ~$175
Most interesting?
“The expected move exceeds the Trend Seeker range,” notes John. “That tells me we’re about to see volatility — and opportunity.”
Rowland adds that if NVDA closes below Trend Seeker and the 50-day MA, that is a red flag.
The Lower-Level Risk: The Turtle Channel
John also pulled up the Turtle Channel, which tracks the lowest price over the previous number of trading days (55 days for this example).
Key Turtle Channel support: ~165
- If NVDA breaks the 50-day
- AND falls below Trend Seeker $182.86
- AND closes below $175 (the lower end of the expected move)
- …then the chart opens the door to a deeper retest near $165.
That doesn’t mean NVDA’s long-term uptrend is broken, but it does mean risk management becomes essential.
The Upside Case: Guidance, AI Spending & Expected Move
NVDA’s expected move is slightly higher to the upside than to the downside, which suggests the options market is leaning bullish.
If the company lifts guidance, signals stronger AI demand, shows its data center ramp accelerating, or provides positive forward visibility, NVDA could push toward the upper end of the channel — near $197 — and possibly break out to All-Time Highs around $210.
This is where Trend Seeker will help traders identify:
- The confirmation signal
- Whether a new bullish trend starts
- Or whether this ends up being a post-earnings fakeout
How Traders Can Prepare Using Barchart
Here are the tools you should monitor going into NVDA earnings:
- Trend Seeker Levels: See real-time bullish, bearish, and hold zones.
- Expected Move: Use NVDA’s options chain to see the market-implied volatility.
- Turtle Channel + Moving Averages: Combine long-term support levels with Trend Seeker signals.
- Earnings Estimates: Track consensus EPS, history, and surprise trends.
Final Takeaway
The upcoming quarterly report from NVDA isn’t just a typical earnings event — it’s one that could influence:
Trend Seeker is telling us the market is waiting, the expected move is telling us a breakout is coming, and John Rowland is telling us to focus on one thing:
“It’s all about guidance. The future matters more than the quarter.”
Watch the Clip: NVDA Earnings Setup Explained
Stream the full Market on Close episode
On the date of publication, Barchart Insights did not have (either directly or indirectly) positions in any of the securities mentioned in this article. All information and data in this article is solely for informational purposes. For more information please view the Barchart Disclosure Policy here.
More news from Barchart
- Here Is What Options Traders Expect for NVDA Stock After Nvidia Reports Q3 Results This Week
- These Are the Critical NVIDIA Stock Chart Levels You Need to Know Ahead of Earnings
- Unusual Options Activity Shows 71,000 Calls Hit the Tape for Applied Digital Stock – How You Should Play APLD Here
- Why MP Materials’ (MP) Implosion Presents a Rare Upside Opportunity for Quants