
The Ark Innovation ETF (ARKK) has taken investors on a wild ride for many years. But unlike your standard rollercoaster, ARKK hasn’t come with any amusement.
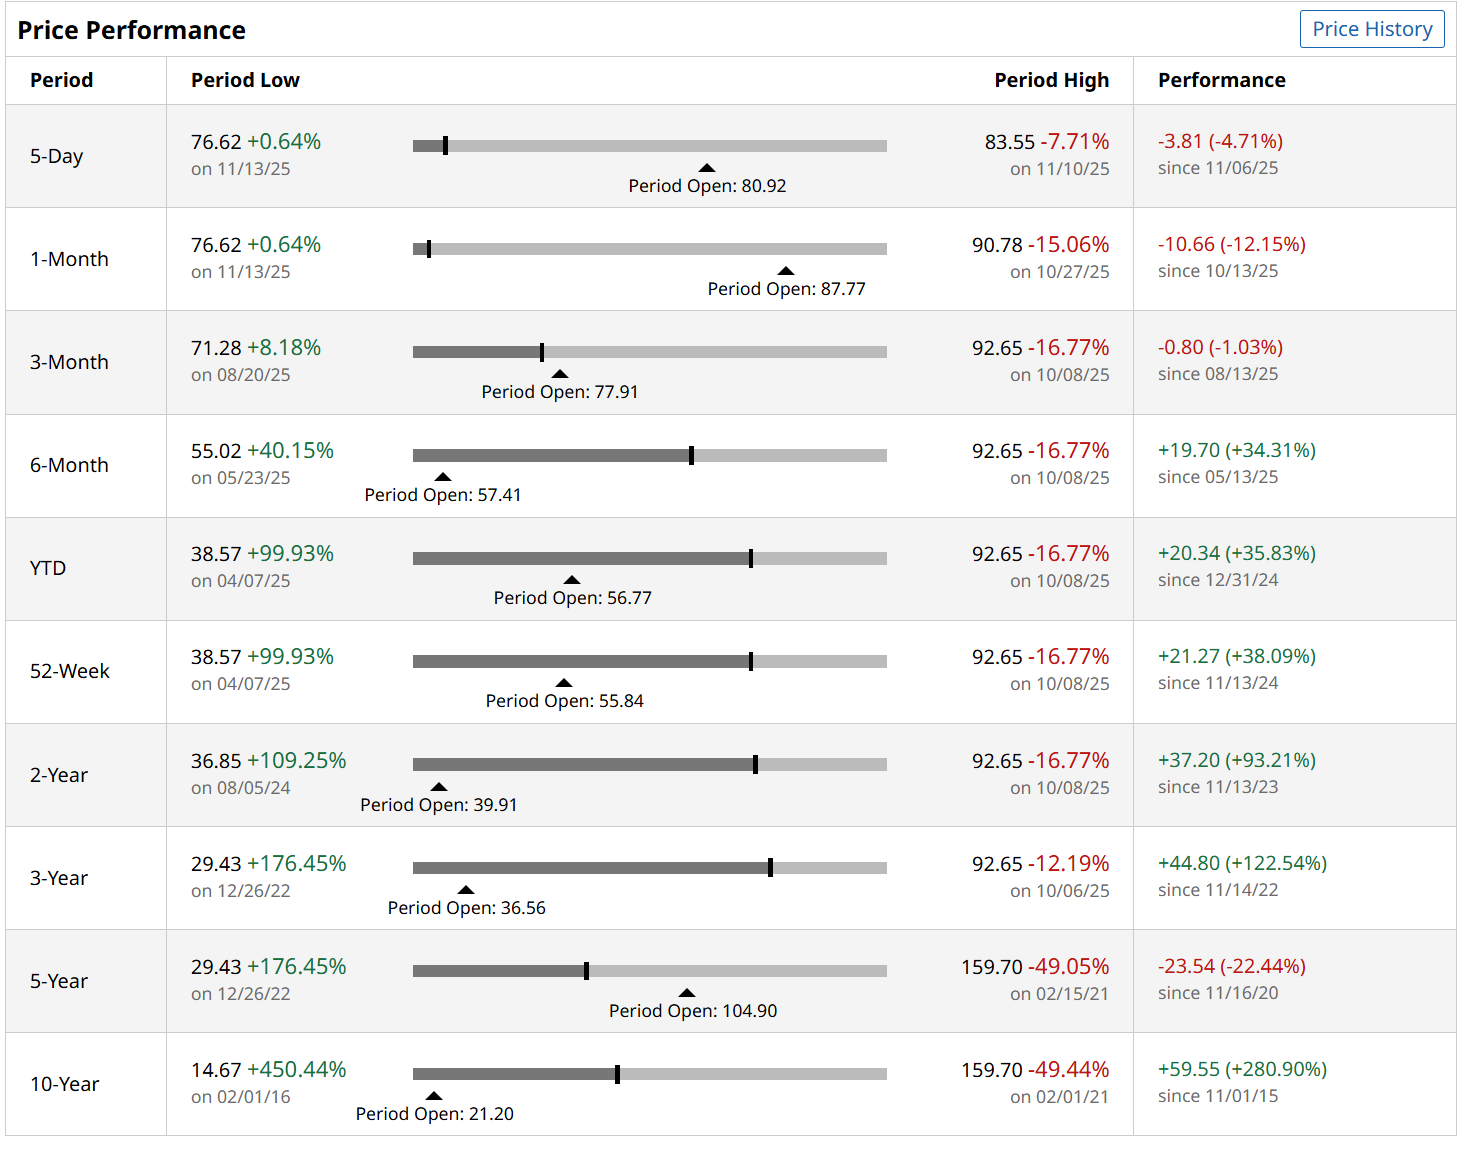
Here’s ARKK over multiple time frames. Obviously, any exchange-traded fund (ETF) or stock can gyrate over time. Even the tamest of stocks have 20% drawdowns in rapid stock market flushouts like we saw earlier this year, in 2022, and in 2020. But this is next-level stuff with ARKK.
Still, the ETF’s loyal following says something about the continued commitment to long-term investing at a time when it seems trading has taken over the market for good.
We won’t know if this is just an era, or a permanent change, for a while. Historically, ARKK has turned over about 40% of its stock portfolio in an average year, implying that 2-3 year holding periods are common.
That’s bound to produce some peaks and valleys. As noted above, ARKK fell more than 12% in the past month, but is up 38% since this time last year. And while it has shed more than 20% of its value as of 5 years ago, its 10-year mark is outstanding, up 280%. Quite a ride.
And, this reminds us that sometimes the biggest losses occur shortly after the biggest rises in price. Even amongst the biggest tech stocks, we’ve seen some rally enormously, only to give it back just as quickly. It doesn’t take a bear market for that to happen.
Charting ARKK’s Course
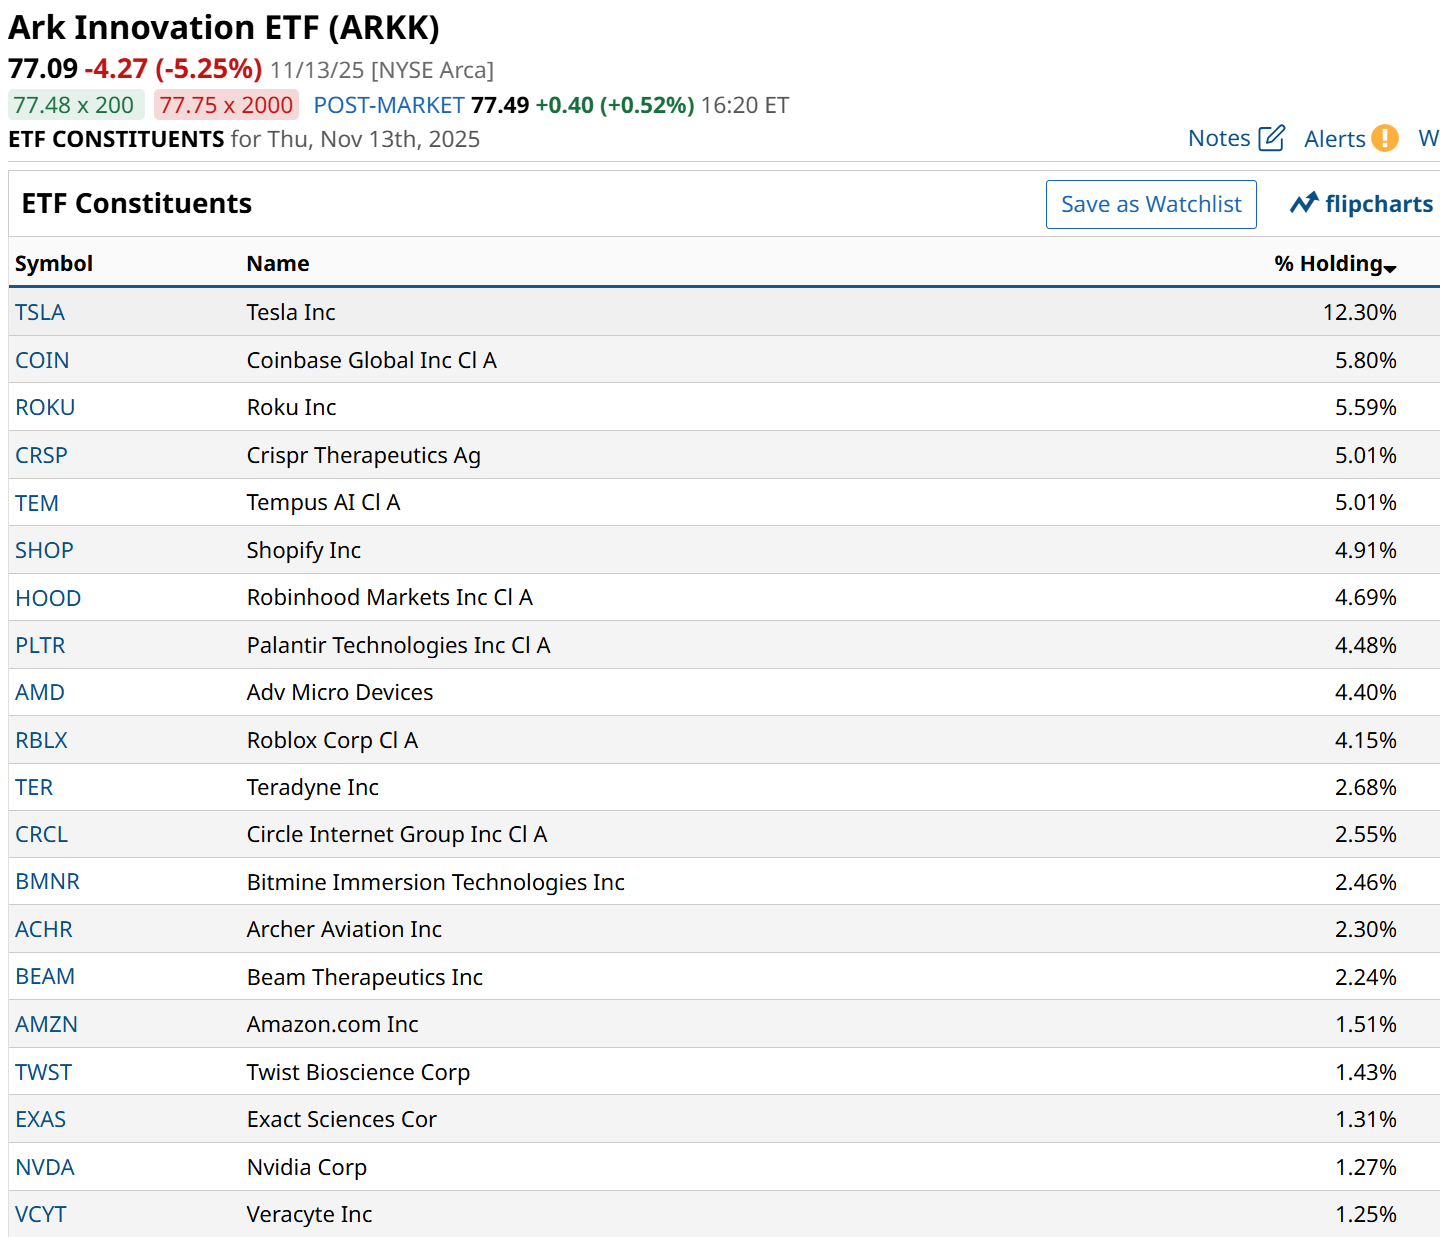
ARKK has a reputation for owning a basket of innovative stocks, and that typically points to a combination of technology firms and pan-sector plays, such as Tesla (TSLA), which is nearly twice the current weighting of any other ARKK position. I’ll dive into some of the top 20 holdings, which are listed further down in this article.
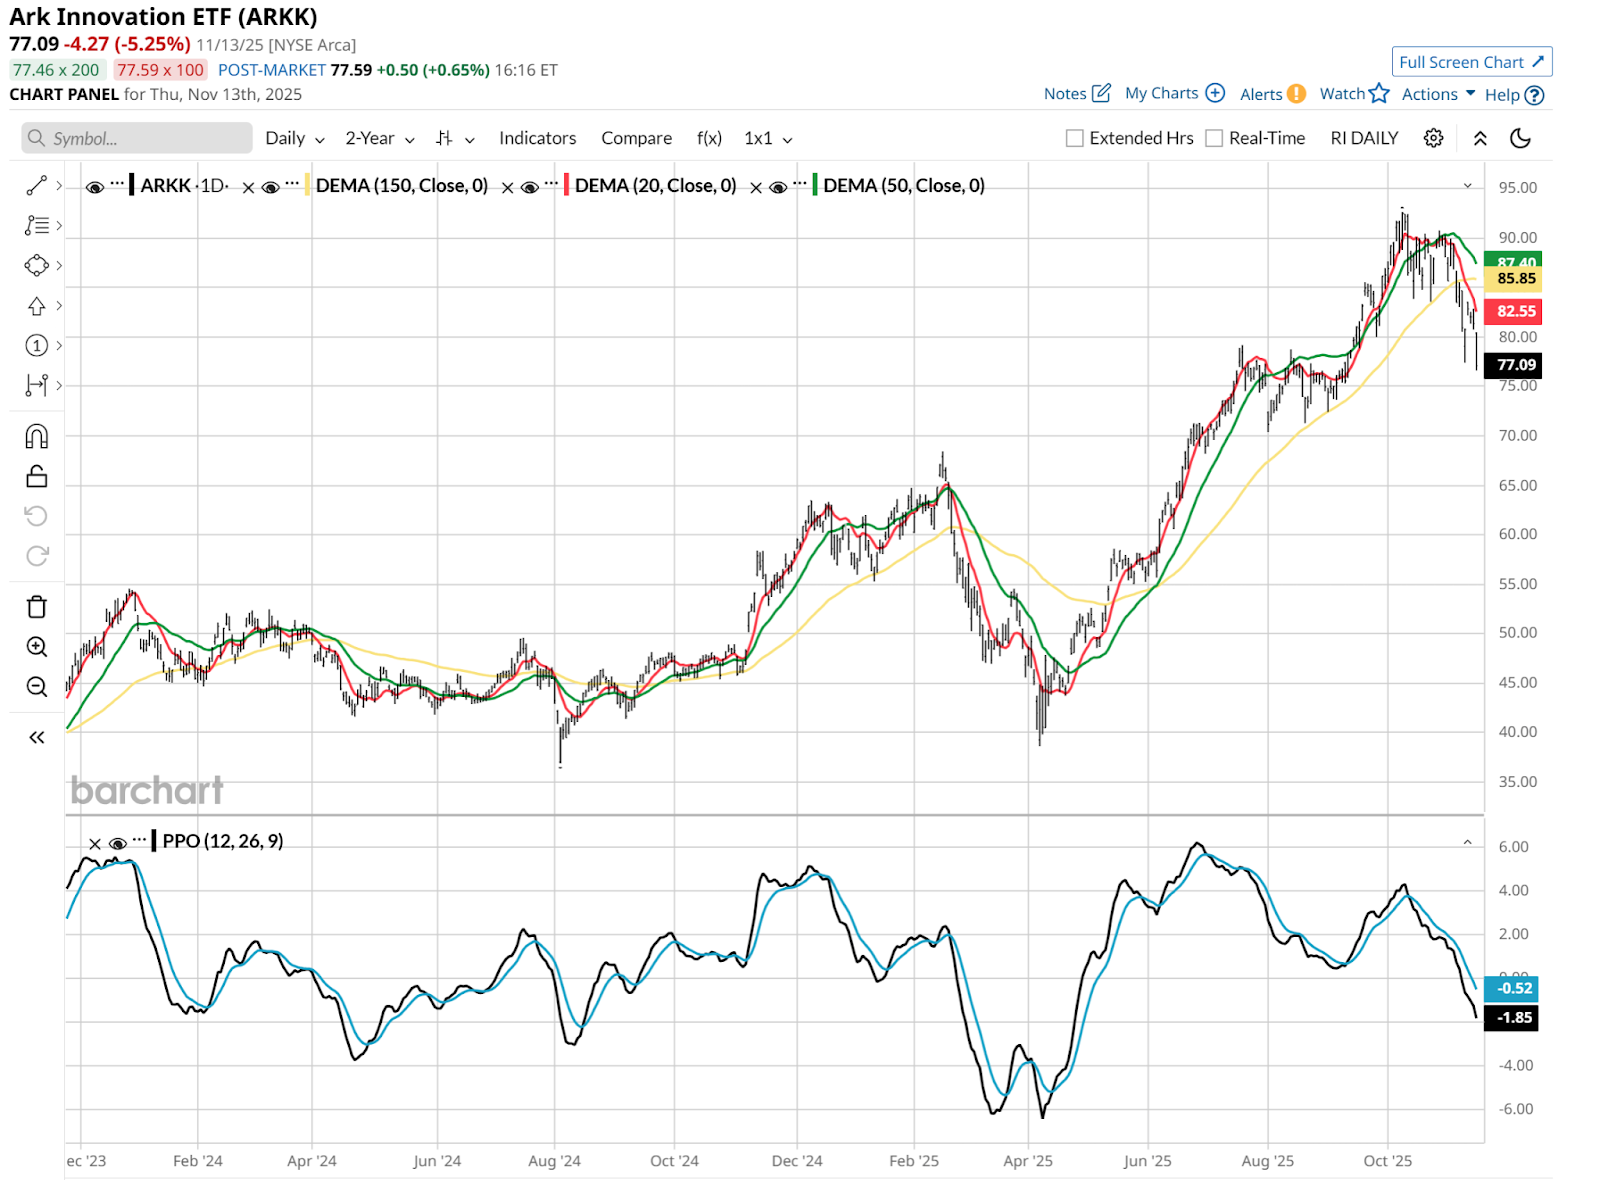
First, let’s chart ARKK, which is an active ETF, not an index-tracker. To the credit of founder Cathie Wood and her team, this fund has essentially carved out its own brand. That’s hard to accomplish in such a giant, commoditized industry like ETFs.
This daily chart looks at best weak, and at worst downright dangerous. Given ARKK’s history of giving back much of what it has gained, the green line, the 50-day moving average turning down recently, has just changed the outlook to negative in my view. That’s confirmed by the Percentage Price Oscillator (PPO) indicator at bottom, which recently crossed down into negative territory. This simply tells me that ARKK is more likely to fall another 10%-15% from its current price level before it rises by 10%-15% from this level.
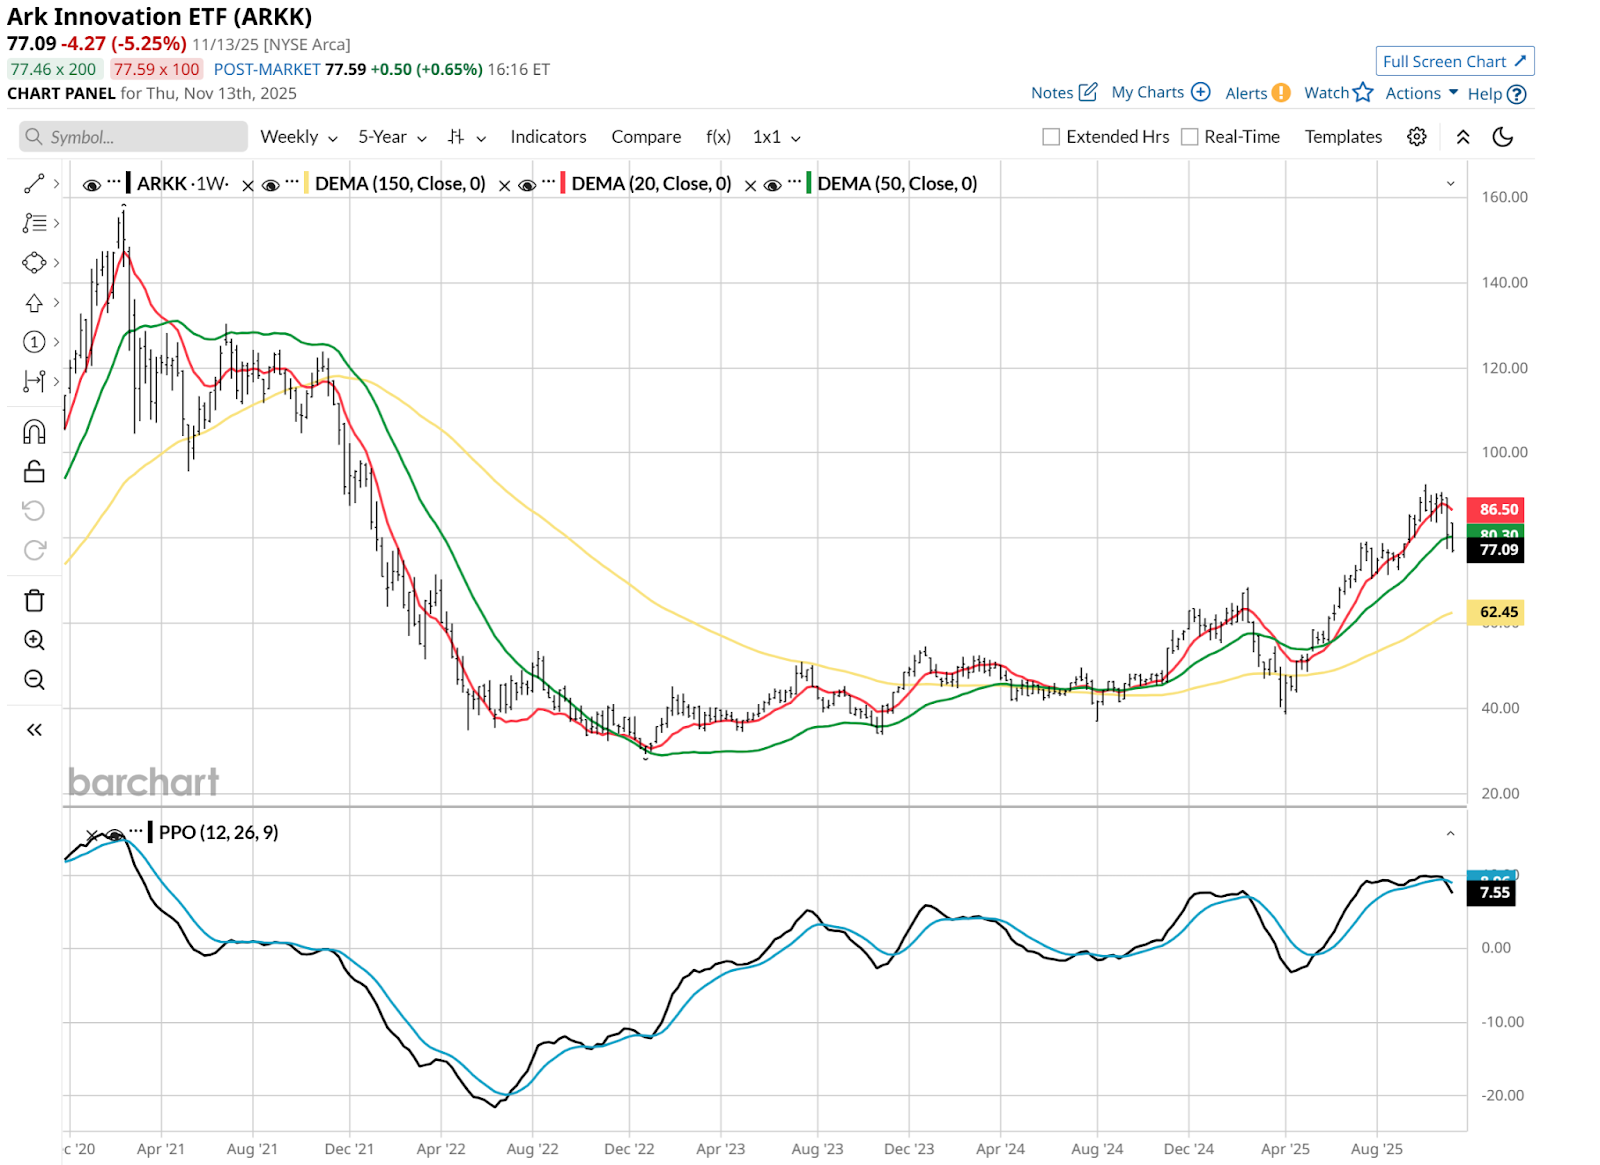
The weekly chart below does not help the bull case for me. Just look at the PPO in the bottom section. It just crossed down. Is that a big deal? It was earlier this year, when ARKK fell more than 30% from a high level around $60, all within about 6 weeks’ time. Sure, the whole market was tanking then, but when things go bad for tech stocks, they go really badly for ARKK. It is high beta for sure.
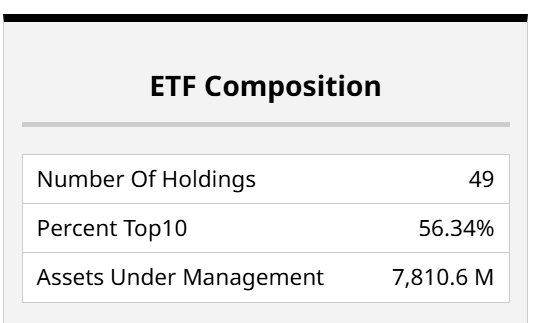
ARKK owns nearly 50 stocks, but the top 10 occupy more than half the real estate here. Let’s look at the top 20 stocks by weight below. They comprise roughly three-fourths of the fund’s assets.
Which Stocks Drive ARKK’s Returns?
In addition to TSLA, ARKK tends to be skewed toward a very small number of stocks, as shown here. This is not a market cap weighted ETF, so you see Nvidia (NVDA) is barely inside the top 20. If this were a market-cap-driven index ETF, NVDA would be the biggest holding by a wide margin.
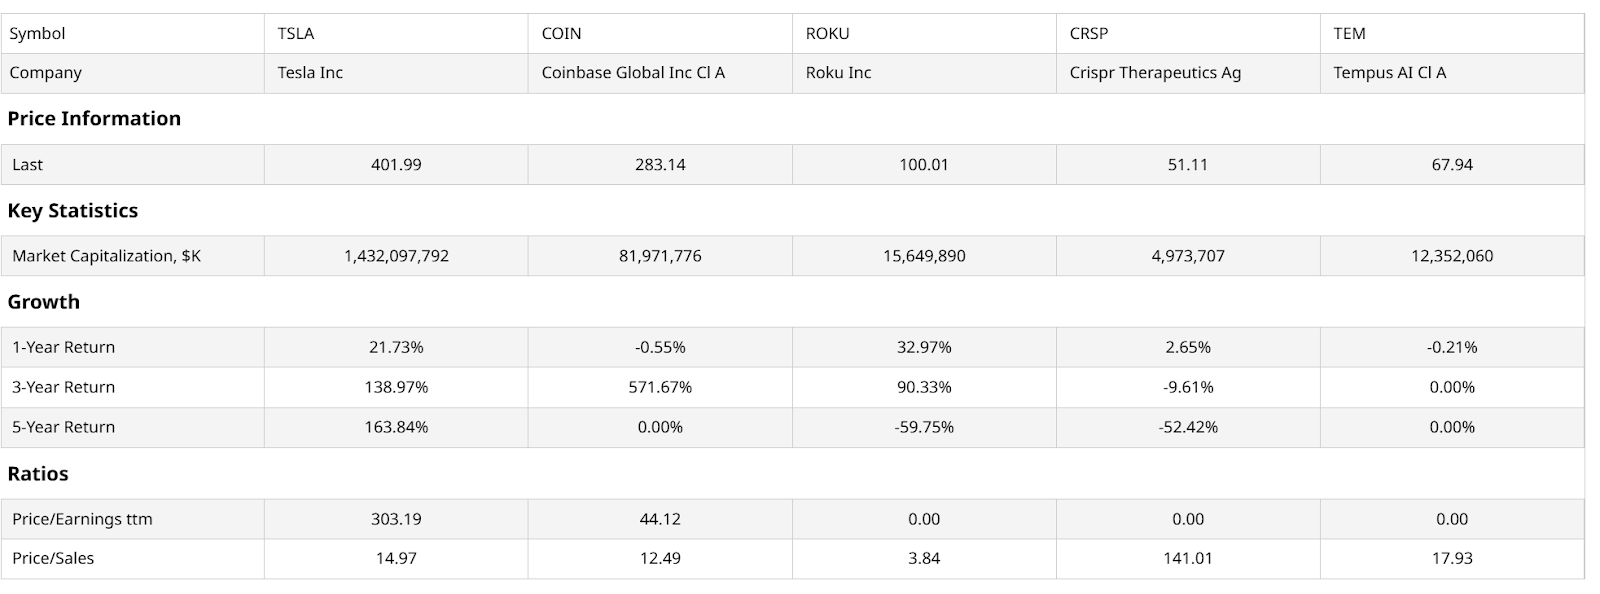
Here is a quick look at ARKK’s top 5 holdings. They are quite varied in company size, ranging from $1 trillion-plus to under $5 billion. The key to ARKK is really a bet on long-term gains from investing in innovators, as defined by the fund’s managers.
But if it is value investing you’re looking for, you won’t likely find it here. And if you do, it means the stocks in ARKK have become value stocks due to oppressive price declines.
What’s the Outlook for the ARKK ETF?
And with several stocks still losing money and price-sales ratios ranging from gaudy to “OMG that’s high,” there’s some faith required here.
ARKK is on my radar now, but maybe not for the reason you think. I’m starting to see this stock market as a tale of two types of growth stocks. There are the big names, which are quite resilient, and are likely the last to fall.
And, there are the rest, which are what I consider to be the “weak hands.” That means they are the ones most likely to be considered expendable, especially by traders and big hedge funds getting margin calls. These are the stocks on my list to try and profit from. First, as they continue to decline (if they do), and then as rebound candidates.
In a market so correlated as this one now is, it is all about beta. When the ARKK leaks, all of Noah’s animals get wet. But some take on more water than others. And from the looks of it, the potential for that leak to become a flood is increasing by the day.
On the date of publication, Rob Isbitts did not have (either directly or indirectly) positions in any of the securities mentioned in this article. All information and data in this article is solely for informational purposes. For more information please view the Barchart Disclosure Policy here.
More news from Barchart
- Should You Buy the Post-Earnings Dip in Monday.com Stock?
- The ARKK ETF Is Leaking, and the Tech Stock Flood Could Reach Biblical Proportions. What Should You Do With Cathie Wood’s Fund Here?
- 1 Outperforming Growth Stock to Buy as the Government Shutdown Ends
- Stock Index Futures Plunge on Fed Rate-Cut Doubts and Valuation Concerns